Table of Contents
Axion's GUI provides the user with a view of the execution trace, and various means of extracting information and analysing it.
Navigation - basics
The main Trace View
This central view represents the flow of instructions of the execution trace.
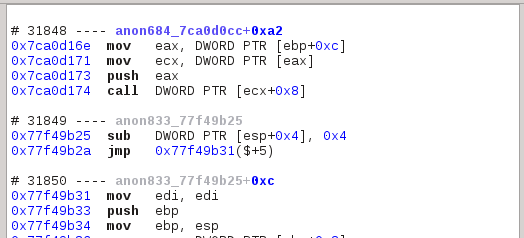
It is divided into sequences in run: you can see above three sequences, each with their identifier, symbol name and offset within that symbol. Where a symbol is not available, we build one in the form of anonXXX_YYY where XXX is a technical number and YYY the start address of that symbol.
The Call Tree View
This widget presents the sequences as a hierarchy based on calls and returns.
You can use this view to filter the main trace view using the Filter button:

By activating it, the main trace view will hide sequences that are hidden in the tree's collapsed branches.
Boorkmarks
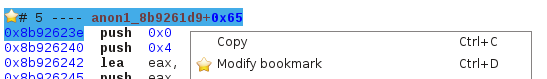
You can store named bookmarks to keep track of interesting places.
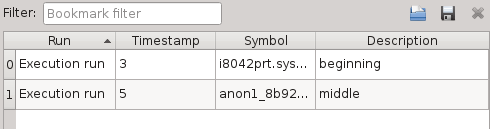
You can use the contextual menu of the trace view or use the appropriate keyboard shortcut to add a bookmark, and then the widget or the shortcuts to navigate through them.
Navigation - advanced
Previous / Next
You can easily follow accesses (reads, writes, or both) of registers and memory locations. First, you need to select what to follow. You can select an instruction's first or second operand by clicking on an instruction
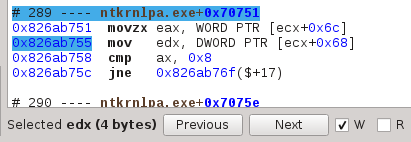
You can also select a register through the register widget, or a memory location from the hex dump view, both through their repsective contextual menus.
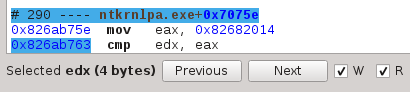
Once an operand is selected, select Read and or Write and navigate using the Previous and Next buttons:
Tainting
The tainter highlights dependencies between memory locations and/or registers. It can work forward (highlight data that is dependant on what you selected) or backward (highlight what your selected operand is dependant on).
The selection process is exactly the same as for the Previous / Next:
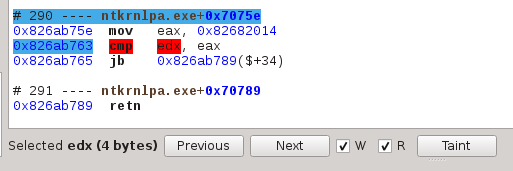
Once your operand is selected, click on the Taint button, then on Forward or Backward in the now opened Tainter widget:
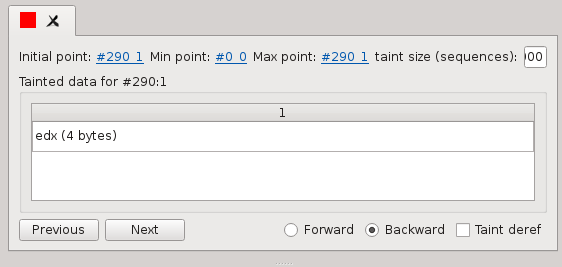
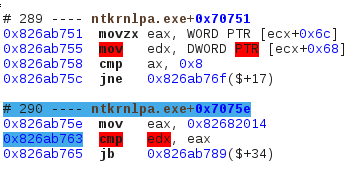
Now you should see operands being highlighted in the trace view.
Memory history
The hexdump view can also display the history of accesses of any memory buffer, as long as the memory history inspector has been selected prior to execution:
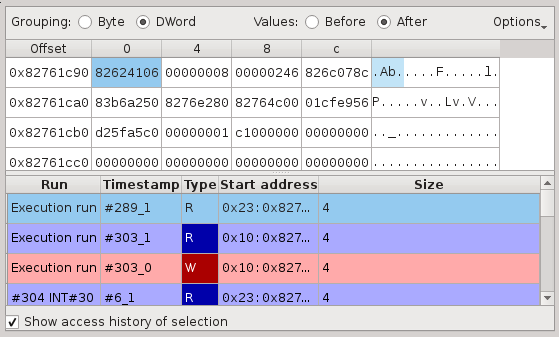
Select a byte, word or even whole buffer and check "Show access history". You should see the list of accesses to that buffer, on which a double click would take you directly to that part of the execution trace.
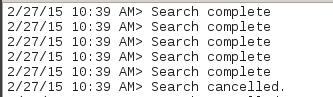
Search
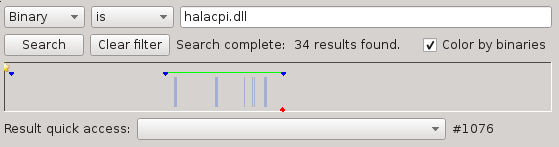
The search widget will search for items in the execution trace. You can search for addresses, binaries, symbols or device accesses.
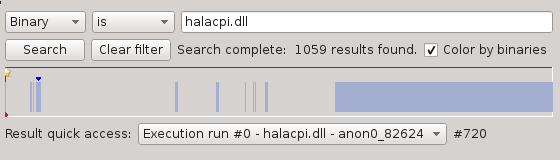
It presents the results in two different ways: A combo-box for quick access and a horizontal bar representing the entire trace.
Note that, should you work on big traces (hundreds of millions of sequences), searching through the entire trace can take quite a long time. You can easily select an execution range to search in by right-clicking and dragging in the horizontal bar:
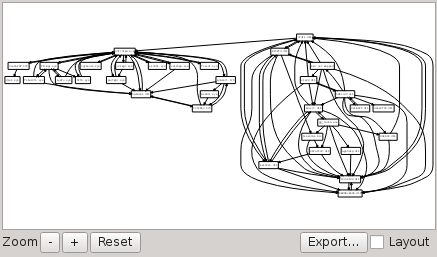
Current symbol graph
You can display a graph of the current symbol and location. In the trace view's contextual menu, select "Explore from here". Then display the symbol graph widget.
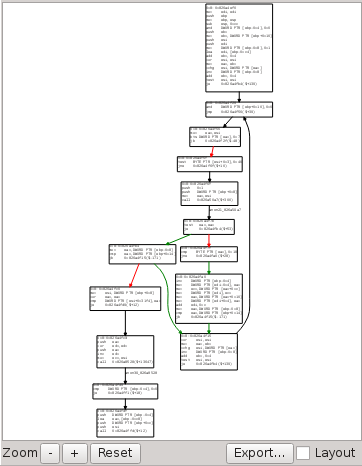
What you see are the different possible paths the execution could take: it's static view of the symbol. It also highlights the actual path taken by the execution.
Contextual information
Part of the information you will see is only relevant to the selected instruction or sequence:
CPU
The CPU widget displays the state of CPU registers.
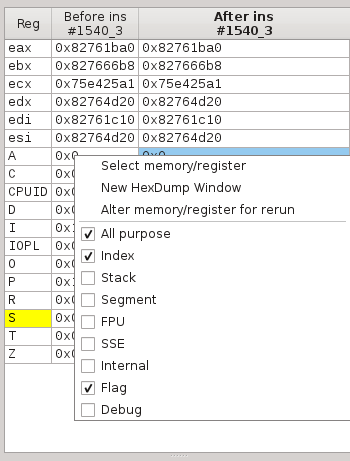
Note the contextual menu in which you can select what group of register you want to see.
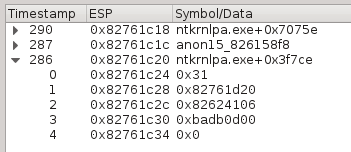
Backtrace
The backtrace widget simply displays the current backtrace, as with any debugger.
Framebuffer
The framebuffer is a view of the machine's screen state
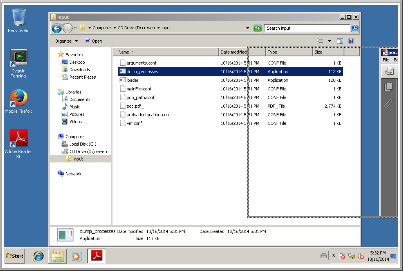
Note that Axion cannot display the framebuffer if you didn't start the binary "dump_process" prior to your binary when you created the scenario.
Aggregated information
There is also information that is not contextual but rather about the entire execution trace:
Strings
The string widget summarize every memory buffer that has been accessed during the execution and that looked like a valid string.
Akin to the memory history widget, you can select a string and see its accesses. You can also filter on the strings you want displayed, if you're looking for a particular pattern. Note that this filter can be slow on huge traces.
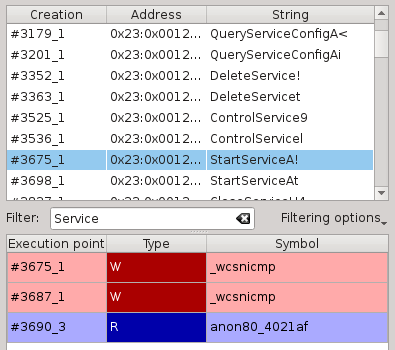
It requires the string inspector to be activated prior to execution.
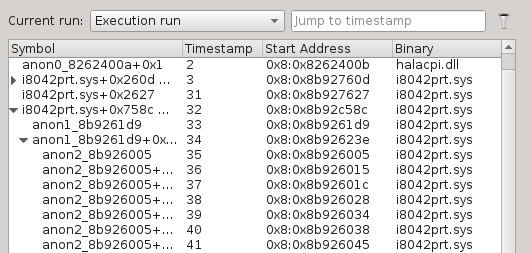
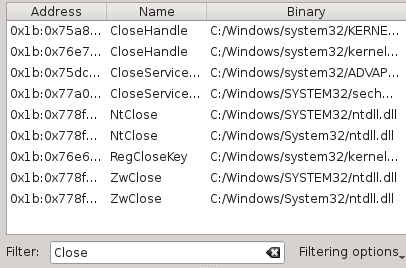
Symbols
Pretty much self-explanatory, this widgets gives a list of symbols that were encountered during the execution.
Binary dependency graph
Displays the known binaries and their dependencies
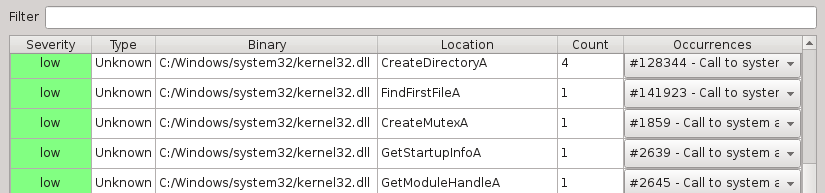
Hot points
This hot points list is a central widget where certain inspectors will push data about execution points that require your attention. For exemple you can find about use-after-frees, providing you activated the appropriate inspector.
Technical information
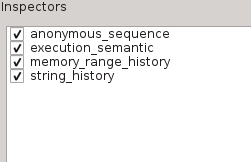
List of inspectors
This widget reminds what inspectors where activated for this trace.
Error log
This is where Axion will display warnings, errors, or important messages. It's a good idea to give it a look after an execution is complete, to make sure everything is okay.