Table of Contents
There are various operations that can be cumbersome to perform if you don't know the various tips. Those can be hard to discover though, so here is a start:
Navigation tips
Lost in the trace? Back button!
The shortcut you might want to learn first is the Back shortcut (Alt+Left by default). It will simply jump back to the execution point you were just before.
Going up a level
While the trace is selected, using the Left arrow will jump to the parent sequence, according to the Tree view. Not the Right arrow may be confusing: it will jump to the next sibling of the parent sequence.
Previous start of current function
This button does exactly what it says: it will determine what function you're in, will look for a previous occurence of that function in the trace and will take you to the beginning of that occurence. It will not take you to the caller of the occurence you're in, though.
Select a register for previous/next
There are various place where you can select a register or a memory for Previous / Next navigation or Tainting:
- Using the first operand / second operand shortcuts on a selected instruction
- Through the contextual menus of:
- The CPU view
- The Hexdump view
Hex dump view
There also are a few differents ways to open an hexdump view to the memory location you want:
Open from the trace
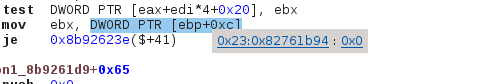
Double-clicking on a memory operand will open this contextual tooltip, where you can see the selected address and the content of the pointed memory. Both are links and will open a new hexdump view to the displayed location - the second link can be useful where the memory operand is a double pointer.
Open from the CPU view
The contextual menu of the CPU view allows you to open a hexdump view, considering the selected register as a pointer.
Goto shortcut
Where there is no other way to open an hexdump you can fall back to pressing Ctrl-G and manually entering the address.
Lost? Jump back to initial address!
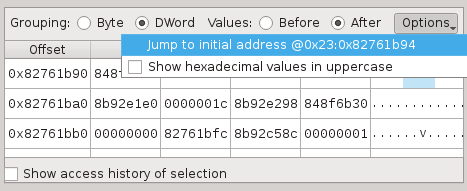
Should you be lost in an opened hexdump view, you can always jump back to the address it pointed first with the Options menu of that widget.