Axion Views
- Trace view
- Trace Filter view
- Search view
- Framebuffer view
- Calltree view
- Backtrace view
- Trampolines
- CPU view
- Hexdump view
- Strings view
- Taint view
- Bookmarks view
- Memory watchers view
- Logs view
Trace view
The Trace view represents the flow of system state transitions in the
recorded scenario under analysis.
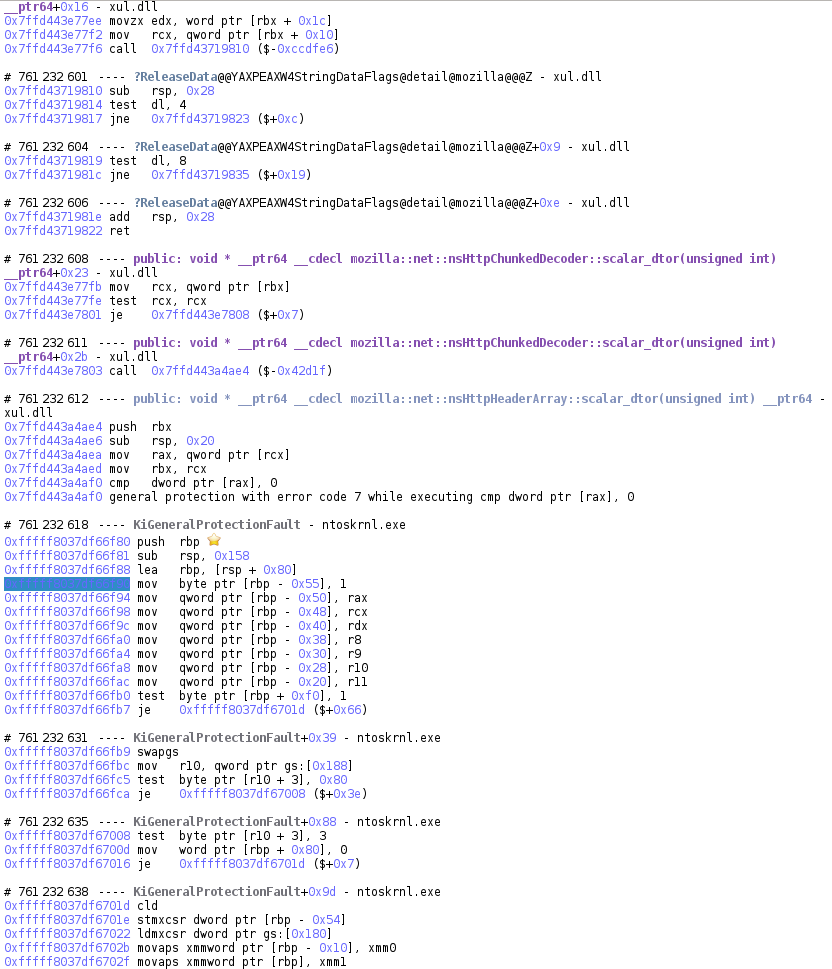
Most of the time, a transition is simply an executed instruction. However, sometimes a transition can be:
- A partially executed instruction (normal execution of the instruction was interrupted by a fault).
- An interrupt.
- A fault or an exception.
Transitions are numbered from 0, the first transition in the trace, to T, the last transition in the trace.
The trace is divided into basic blocks. Basic blocks contain transitions
occurring on contiguous code addresses. In the Trace view, each basic block
is identified by the number of its first transition, the name of the
symbol in which the transition occurs and the offset within that symbol.
NOTE: symbol information is only displayed if the OSSI information sources have been previously configured for the scenario's VM and files.
Tips
- You can select any item in the trace, such as an instruction or a register for example. All similar items will be displayed with a yellow background.
- You can select any operand in the trace and, if appropriate, open a
corresponding
Hexdumpview.
Trace Filter view
The Trace Filter view represents a high level view used to filter the trace.
It displays a list of all the processes present in the trace.
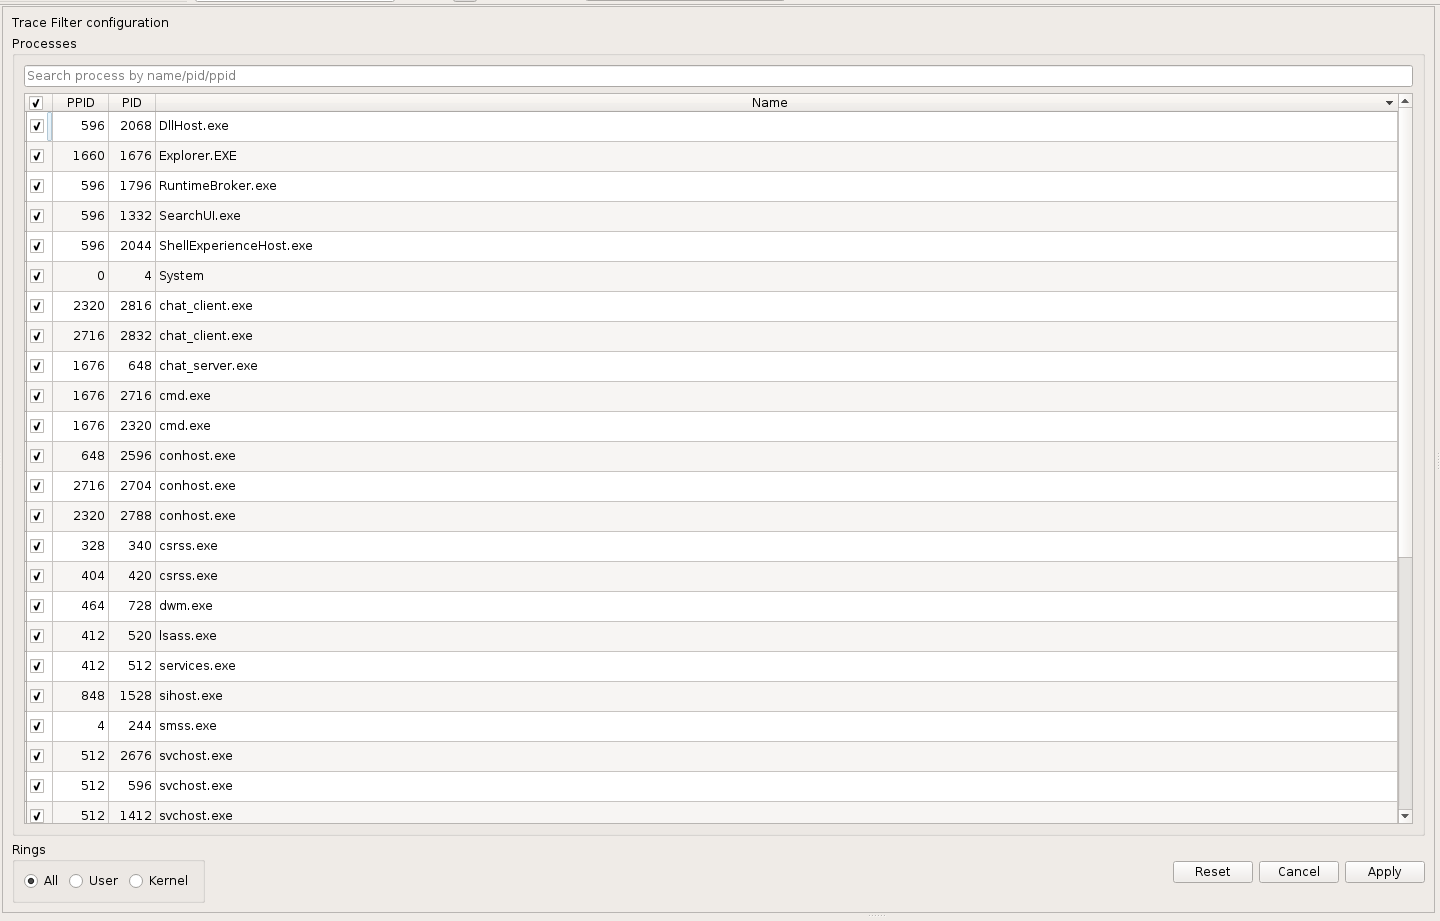
The trace can be filtered by checking/unchecking the processes in the list,
and by selecting which rings are of interest: User space, Kernel space, or both.
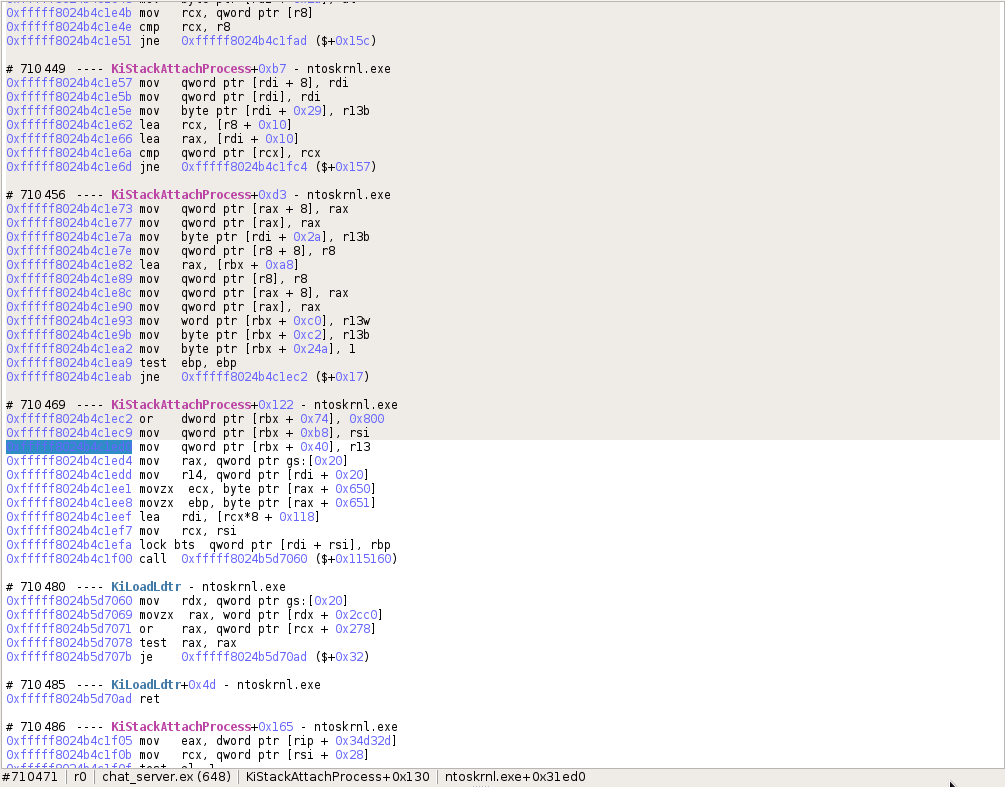
In the Trace view, transitions that do not match the filter are displayed with a gray
background.
In the Trace view, navigation from one transition matching the filter to the next one,
skipping the transitions outside the filter, can be done either using the
filter navigation buttons in the toolbar, or the dedicated shortcuts (F6/F7 by default).
It is also possible to move from a range of transitions matching the filter to the previous/next range by using the
filter range navigation buttons in the toolbar, or the dedicated shortcuts (Alt+F6/Alt+F7 by default).
Trace filter toolbar:

A filtered trace view is displayed as the following:
Search view
The Search view allows to search some points of interest in the Trace
view. Points of interests can be:
- Any transition.
- A transition with a given code address executed.
- A transition with a given binary executed.
- A transition with a given symbol executed.
- A transition with a call to a given symbol.
The Search view is composed of:
- A filter form to select points of interest to search.
- A zoomable timeline representing the whole set of transitions in the scenario and displaying where results are found in the trace.
- An exhaustive list of results.
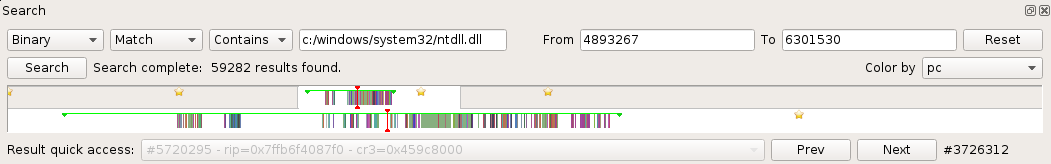
Using the timeline
Going to some place in the trace
The Timeline allows to go directly to some place in the trace just by
clicking on it. A vertical red bar represents the current location in the Trace view.
Manipulating the zoom
The Timeline can be zoomed-in/out using:
- the keyboard with the zoom-in/zoom-out sequence key, usually Ctrl++/Ctrl+-.
- the mouse with Ctrl+WheelUp/Ctrl+WheelDown and Left-click + drag and drop to select the zoom area.
When zoomed in, the background of the zoomed area is white.
The zoomed area can be translated left or right using:
- the keyboard with the Up key, the Left key or the PageUp key (faster) to move to the left and the Down key, the Right key and the PageDown key (faster) to move to the right.
- the mouse with Wheel Up to move to the left and Wheel Down to move to the right.
The zoom can be reset using Ctrl+0.
Searching a sub-range of the trace
On large traces, a sub-range can be selected in the Timeline to reduce the
scope of a search:
- Right-click + drag and drop in the timeline: a green line represents the currently defined sub-range.
Going to a bookmark
The Timeline also displays bookmarks set in the Trace. Click on the
bookmark icon in the timeline to get to the bookmark in the trace.
Searching and browsing some points of interest
- Fill the search form with your search parameters.
- Click the Search button and wait for the results to appear in the timeline and in the result dropbox.
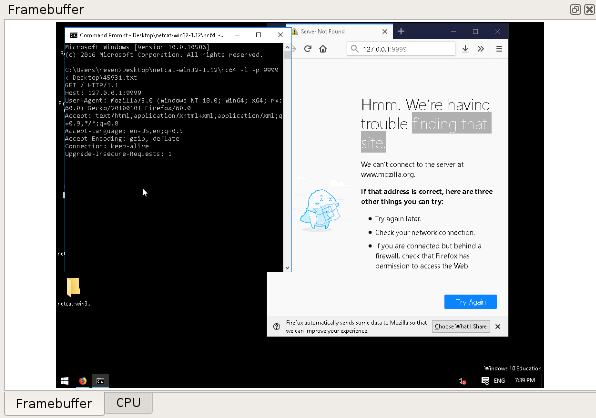
Framebuffer view
The Framebuffer view provides a view of the machine's screen state for a
given transition selected in the Trace view.
NOTE: the Metadata replay must have been run for the Framebuffer view to be available.
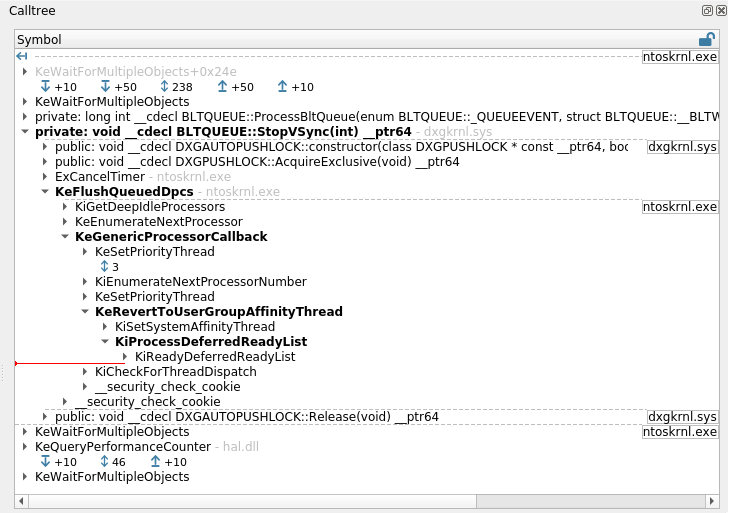
Calltree view
The Calltree view provides a tree representation of the ancestor and sibling calls
around the currently selected transition in the Trace view. This calltree is dependent
on the stack currently in use, and as such is local to the current process and thread.
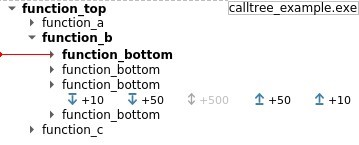
The following is a code block with its corresponding calltree. The calltree widget adds a
hole item when there are many siblings. This hole item contains buttons that can be used
to request more siblings. In the example below, the hole item represents hidden calls
to function_bottom, made by function_b in a for loop.
|
|
The Calltree view is initialized with a minimal call tree that can be enriched by the user.
List of actions available in the Calltree view:
- Display more sibling

- Display children

- Display more ancestors

The Calltree view displays several other important pieces of information:
- A horizontal red line representing the current selected transition.
- The calls belonging to the current backtrace are displayed with bold font.
- Binary names are displayed at the right side of the view. Only binary changes are displayed. The destination binary of a call is displayed beside the call if its children are hidden.
By default, the Calltree view is updated every time the active transition is changed.
This behavior can be disabled by clicking on the lock button  .
To re-enable it, click on the unlock button
.
To re-enable it, click on the unlock button  .
Only the tree will be locked, the location of the active transition and the current backtrace will still be updated.
Note that if the current transition is not using the stack where the call tree view is locked in,
no current transition will be displayed.
.
Only the tree will be locked, the location of the active transition and the current backtrace will still be updated.
Note that if the current transition is not using the stack where the call tree view is locked in,
no current transition will be displayed.
Double clicking on a call item will change the active transition to the one that make the call. This will not update the tree, even if the widget is unlocked.
NOTE This view represents an attempt at rebuilding this information from the trace's content, and sometimes cannot be comprehensive. In that case, information from earliest calls may be missing or partial. Therefore double clicking certain entries is not possible.
NOTE: the Stack Events resource must have been replayed for the Calltree view
to be available.
Backtrace view
The Backtrace view provides a list of nested calls for the currently
selected transaction in the Trace view, akin to what would be
expected in a debugger. This backtrace is dependent on the stack currently
in use, and as such is local to the current process and thread.
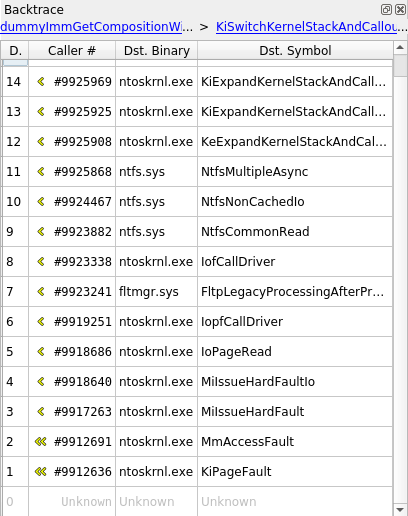
On the upper part of the widget are two links which, when possible, provide a quick way to navigate between stack switches (i.e. when the stack pointer points to a different stack) - these moments can be process switches, ring changes, process creations, etc. The left link points to the previous stack switch, and the right link to the next stack switch.
Below these links is a list of calls, sorted from latest to earliest. You can double click an entry to get to that call.
NOTE This view represents an attempt at rebuilding this information from the trace's content, and sometimes cannot be comprehensive. In that case, information from earliest calls may be missing or partial. Therefore double clicking certain entries is not possible.
NOTE: the Stack Events resource must have been replayed for the Backtrace view
to be available.
Trampolines
The backtrace as well as the Calltree widgets support trampoline calls. Trampolines are situations where the program calls an intermediary address that in turn jumps to the actual function code. See an example below:
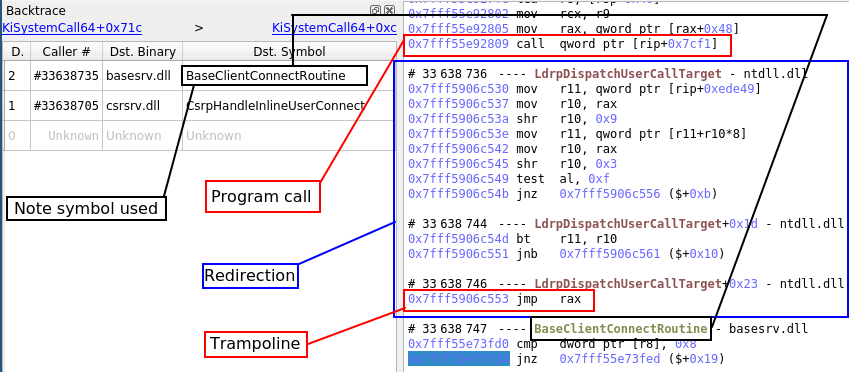
In this case, the selected transition is after both the call the trampoline jmp, so the backtrace displays the target function. However, if the selected transition is between the call and the trampoline jmp, the backtrace will show the call destination:
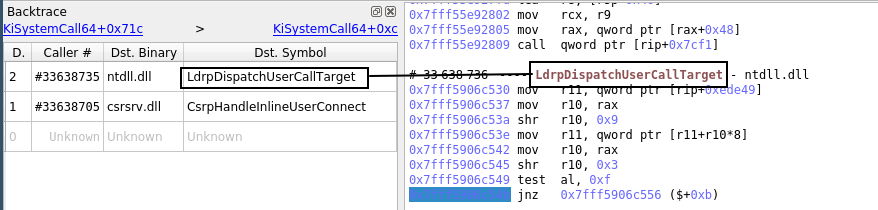
The detection of these trampolines is a heuristic and can sometimes be wrong. It is possible to ignore that information and only show the call destination by unchecking Replace calls with detected trampolines in Axion's Settings dialog window.
CPU view
The CPU view displays the state of CPU registers:
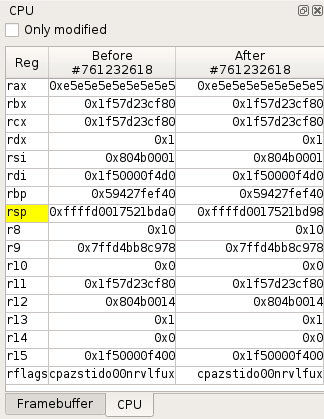
- By default, when a transition is selected in the
Traceview, it shows the CPU registers values before and after the transition. - From the
Timeline, you can also compare the CPU contexts between any two transitions in the trace.
Registers whose value has been modified by a transition or between two transitions are displayed with a yellow background. A checkbox allows you to display only modified registers.
The contextual menu provides the following actions:
- Select memory/register can be used to:
- Browse the register changes with the
Traceview Prev and Next buttons. - Open a new
Hexdumpview at the selected address.
- Browse the register changes with the
- Open an new
Hexdumpview. - Configure which registers must be displayed.
Hexdump view
The Hexdump view shows the content of the memory starting at a given address,
before or after a given transition in the trace.
By default, the Hexdump view that had the focus last will be reused when changing the memory location.
Several Hexdump views can also be opened at the same time for different memory
locations by clicking the "duplicate" button.
If a memory location is not mapped at the selected execution point, ? characters will be displayed instead of its
content.
The "previous/next" arrow buttons of a Hexdump view can be used to go back and forth between visited memory
locations, similar to a browser history.
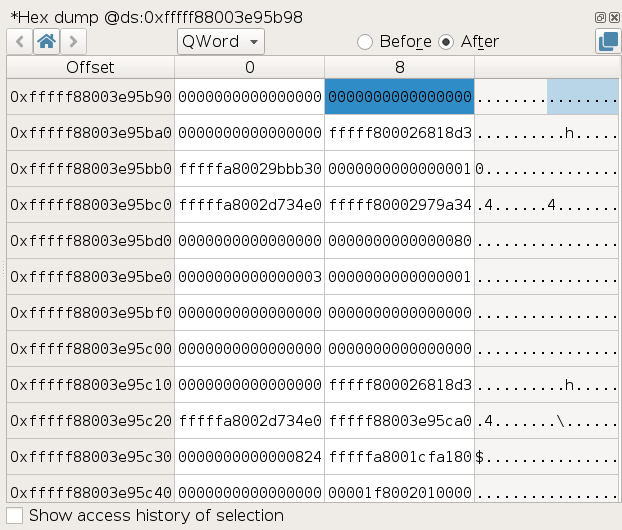
Memory history
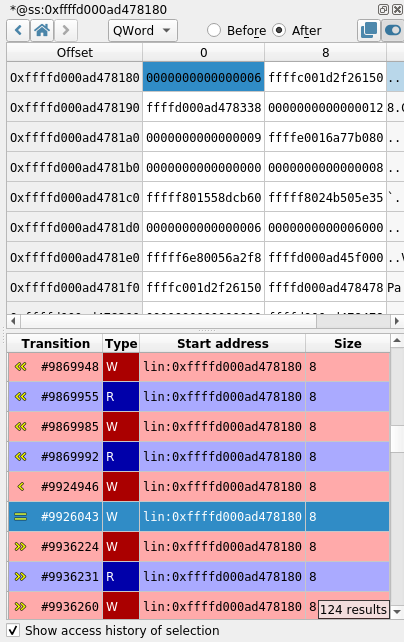
The Memory History view displays the history of the accesses to the selected memory buffer.
NOTE: the Memory History replay must have been run for the Memory History data to be available.
To display the history of a memory buffer:
- In a
Hexdumpview, select a Byte, DWord, QWord or any continuous range of memory. - Check Show access history of selection.
The list of Read and Write accesses to the buffer in the trace will then be displayed, centered on neighboring accesses. Each access is described with:
- A transition number in the trace.
- The access type R for read, W for write.
- The start address of the accessed memory.
- The size of the memory accessed.
To go to the transition in the trace corresponding to a given memory access, double-click its entry in the list.
Note this history reflects the activity of the physical region that the selected virtual area points to. This means that it can contain accesses to this area made through other virtual addresses if for example this area is:
- Shared with another process.
- Mapped elsewhere in the same process.
- Accessed via a physical address directly (by peripherals for instance).
- Reused later on in a different context.
Advanced details
There are a few specific details that are good to know, as they could otherwise be confusing:
- The history may not track internal accesses, such as those performed by the MMU itself while resolving accesses.
- The history does not track failed access attempts leading to page faults - unless if said access spans over more than one page and the first page is mapped but the rest is not, in which case there will be an entry for the first part of this access.
- What would intuitively be expected as a single access may appear sliced into consecutive smaller ones in various cases (access is more than 8 byte large, access spans over more than one page, etc.). This is tracer dependent.
- Certain instructions might generate counter-intuitive accesses: for instance,
BTS(bit test and set) may access a whole 8-byte region. Again, this is tracer dependent.
Strings view
The Strings view allows to display and filter all accessed memory buffers
in the trace that look like valid strings.
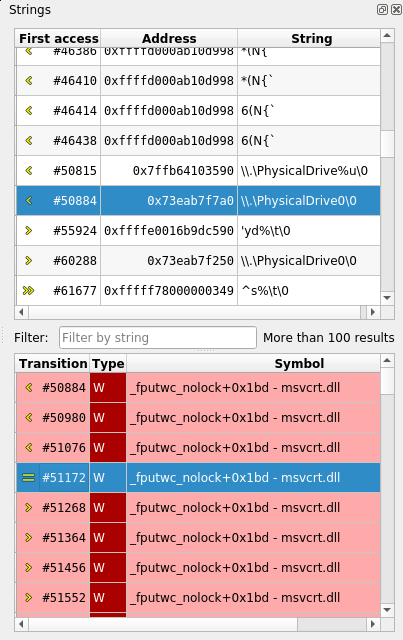
Each accessed buffer is described with:
- A transition number in the trace.
- The memory address of the buffer.
- The string value.
To view the access history of a buffer:
- Select the buffer in the list by clicking on it + Enter or double-clicking on it.
Each entry in the access history shows:
- A transition number in the trace. Double-click on the entry to get
to the transition in the
Traceview. - The access type R for read, W for write.
- The Symbol that performed the access, if known.
NOTE: the Strings replay must have been run for the Strings data to be available.
Taint view
The taint view allows to follow the data flow in the trace, either forward or backward.
The taint analysis automates the task of following some data from memory buffers and registers to other buffers. When performing a backward taint, it allows to find the origin of the tainted data.
Specifying taint parameters
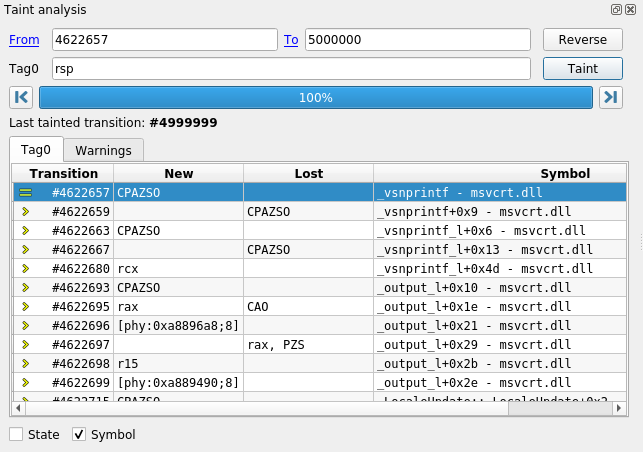
On the upper part of the widget are some input controls that allow to specify the taint parameters:
Fromindicates the first transition to taint.Toindicates the first transition not in the taint.Tag0indicates which data should be marked. For more information on what data can be tainted, please refer to the Taint data format section.
To perform a backward taint, the transition number in the To control should
be lower than in the From control (e.g., From = 2968405, To = 0).
Otherwise, the taint will be forward.
The Reverse button allows to swap the content of From and To, switching
between a forward and a backward taint.
Browsing results
On the middle part of the widget are several tabs. The Tag0 tab contains a table indicating all changes to tainted data that occurred during the taint.
You can use the |< and >| buttons around the progress bar to navigate directly to the start or the end of the taint. Note that if the taint is still being calculated, >| will take you to the latest known result.
To scroll within the table, use the mouse wheel or the keyboard Page Up / Page Down and arrow keys.
Note that the vertical scrollbar, while available when there are few results (in the hundreds), is not available on larger taints due to the way taint results are fetched.
Interpreting taint results
For each taint change in the list, the following information is provided:
Transition: the transition number of the change.New: shows data newly tainted.Lost: shows data that just lost taint. You can double click any entry in that list to display the transition where the change occurred in theTraceview.Symbol: if you checkedSymbolat the bottom of the widget, this column will show the transition's symbol as well.
NOTE: If you encounter any problem with the taint, you can check the Warnings tab to see some information about what happened during the taint process, in the neighborhood of displayed results. The warnings are also displayed as a clickable Warning icon next to the affected change in the change view. It is recommended to manually check changes when there is a warning icon displayed next to them.
The bottom part of the widget can be activated by checking the State
checkbox. It presents the current state of all tainted data at the transition that is currently selected in the trace.
NOTE: Although, internally, the taint works using physical addresses, the taint attempts to rebuild linear addresses in the taint state view. These linear addresses are clickable links that will open a new hexdump.
Taint data format
Various kinds of data can be tainted, here is a list:
- A register:
rax,rbx,eax,ah - A slice of register:
rax[0:3](is the same aseax),rax[2] - A byte of logical memory (implicit ds segment):
[0x4242]taintsds:0x4242 - A range of logical memory (implicit ds segment):
[0x4242; 2]taintsds:0x4242andds:0x4243 - A byte of logical memory (segment register):
[gs:0x4242]taintsgs:0x4242 - A range of logical memory (segment register):
[gs:0x4242; 2]taintsgs:0x4242andgs:0x4243 - A byte of logical memory (numeric segment index):
[0x23:0x4242]taints0x23:0x4242 - A range of logical memory (numeric segment index):
[0x23:0x4242; 2]taints0x23:0x4242and0x23:0x4243 - A byte of linear memory:
[lin:0x4242]taints linear address0x4242 - A range of linear memory:
[lin:0x4242; 2]taints linear addresses0x4242and0x4243 - A byte of physical memory:
[phy:0x4242]taints0x4242 - A range of physical memory:
[phy:0x4242; 2]taints0x4242and0x4243
NOTE: Several pieces of data can be tainted at once for each tag.
Example: Tag0: [0x2523808; 24], rax[4], rsp, [phy:0x1234f] will tag
ds:0x2523808 through ds:252381f, the fourth byte of rax, the entirety of
rsp and the physical byte at address 0x1234f.
Known limitations
- The taint may fail to propagate the taint on some instructions
(notably,
swapgs). The corresponding warning message isunable to lift instruction. - The taint may fail to propagate correctly on FPU instructions. The
corresponding warning message is
X87 FPU access in forward taint analysis. - The taint uses information obtained at the basic-block level to infer local
simplifications (for instance, it can infer that in the instruction sequence
{mov rax, rbx; xor rax, rbx}, thexoralways resetsraxto 0.). This inference may result in surprising displays in the table views, in backward (some register may lose the taint at one instruction, and some memory may "regain" the taint, apparently from nowhere). This is simply a display limitation and does not otherwise affect the correctness of the taint. - Tainting large ranges of memory (several MB) may result in a very slow taint that uses a lot of CPU.
- Only a single taint can run concurrently per REVEN server: currently, starting a second taint, even from a different Axion, will cancel the first running taint. Besides, if two Axion sessions are involved, the first Axion session may display mixed taint results.
Bookmarks view
The Bookmarks view lists bookmarks that you can create on any transition in
the trace, together with a name and a comment.
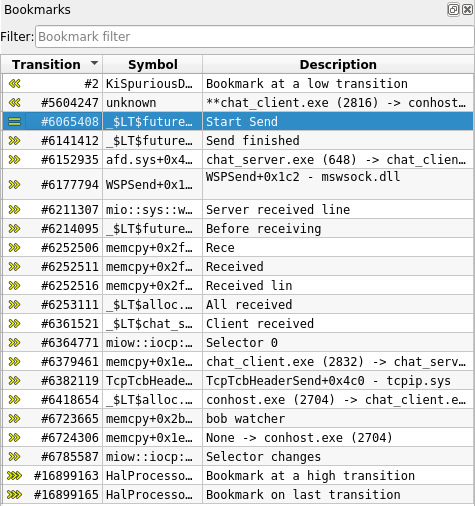
To create a bookmark:
- Select a transition in the
Trace view. - Click right to get to the contextual menu and select Add bookmark (or use the corresponding keyboard shortcut).
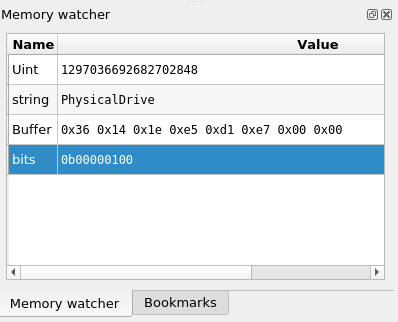
Memory watchers view
The Memory watchers view lists watchers that you can create on any virtual memory range in
the trace, together with a name, a basic type information and a description.
In order to be as light as possible during the analysis, the view only displays the watchers' name and their value in memory at the current transition in the trace. To see the description, click right to get the contextual menu and
select Edit.
The value in memory:
- will be updated at each transition change.
- is formatted according to the basic type the memory watcher is assigned.
There is 3 ways to create a memory watcher:
-
Manual creation:
- Select the
Viewmenu - Select
Create Memory Watcher
- Select the
-
From a memory operand in the
Traceview:- Double click on an operand
- Click right to get the contextual menu and select
Watch memory
-
From a
Hexdumpview:- Select the memory range to watch.
- Click right to get the contextual menu and select
Watch memory
Logs view
The Logs view displays information, warning, error messages encountered by the Axion GUI.
It is a good idea to check this view when something unexpected occurs in the GUI.