REVEN v2 - User documentation
Welcome, this is the starting point of REVEN v2's user documentation. It will guide you through:
- Installing REVEN v2.
- Managing VMs and RE scenarios with the Project Manager.
- Analyzing RE scenarios in the Axion GUI.
- Automating analysis using the Python API.
- Automatic recording cookbooks provide recipes for performing automatic records using REVEN v2.
Please send any request or comment to support@tetrane.com
REVEN v2 installation guidelines
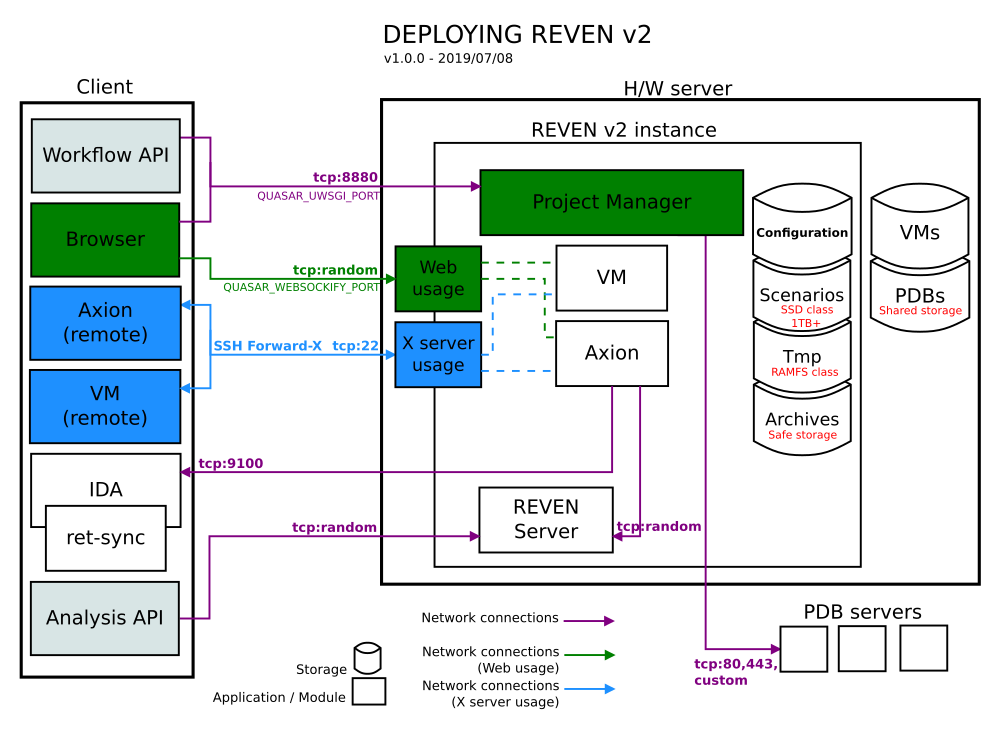
This section will guide you through the process of installing REVEN. You will find in Annex I an overview of REVEN deployment.
Pre-requisites
Server hardware
Here are some configuration hints for running an instance of REVEN:
Minimum configuration:
- Intel processor with VT-x such as Intel Core i7 or Intel Xeon
- 16GB RAM
- 1TB SSD
Recommended configuration:
- Intel processor with VT-x such as Intel Core i7 or Intel Xeon, running at 4GHz, with at least 8 hardware threads
- 64GB RAM
- 2TB SSD connected with NVMe + 4TB HDD
- Internet access for symbol information downloads
Any type of RAID-0 configuration may help reduce the disk I/O bottleneck.
Debian operating system
The REVEN v2 package must be installed on a Debian 9 Stretch amd64 system.
Storage
The list below shows how REVEN organizes its data, together with the corresponding configuration variables that can be set during the installation process.
-
Installation path:
QUASAR_REVEN_ROOT_PATH
Automatically set bystart.shwith its own directory. -
VM:
QUASAR_QEMU_SCAN_PATH
The VM repository containing the QEMU images, should be fast for snapshot save/load operations. -
REVEN scenarios:
QUASAR_ROOT
VM-specific files such as their filesystems, the REVEN recordings, the replay files, which may be quite large (hundreds of GB). Storage requires a high I/O throughput, to get the best performance out of REVEN (e.g. SSD).
Since this directory will contain SQlite databases, be careful not to have it being in an NFS mount, or you may experience some difficulties and bugs. -
PDBs:
QUASAR_SYMBOL_STORE
Can be shared between users and/or machines. -
Archives:
QUASAR_ARCHIVES_PATH
The scenarios exports. Can be used for backups. Storage can be slow, should be safe (RAID, ZFS, ...). -
Temporary directory:
QUASAR_TMP
A work directory for REVEN. The faster the better. Putting that directory in a RAMFS mount point will even help reduce latency during scenario recording.
Networking
The list below shows the network connections that must be open between the REVEN server and other machines. Make sure any filtering device is configured to allow these connections.
-
Main project manager interface:
QUASAR_UWSGI_PORT
By default, the project manager listens on port 8880. -
VMs and Axion Web usage:
QUASAR_USE_VNC=True
By default, VMs and Axion displays are served through a random port. The settings variableQUASAR_WEBSOCKIFY_PORTallows to set a fixed value for this port. -
VMs and Axion X server usage:
QUASAR_USE_VNC=False
You must be able to run X server applications in the terminal where REVEN is started: remote X or native X server will both work.
A common situation is to use SSH X forwarding, in which case the SSH port must be open. -
REVEN server ports: REVEN server listens on any port of the ephemeral port range, which defaults to [32768, 60999] on Debian. You may want to access these ports when using the REVEN Python API remotely, in which case a VPN may prove useful.
NOTE: implementing a reverse-proxy in front of REVEN may simplify the requirements on network filtering. Please refer to the specific reverse-proxy section.
-
Connections to the symbol servers:
QUASAR_SYMBOL_SERVERS
Any symbol server listed in the symbol server list must be accessible to the project manager and the REVEN server. -
Connection to ret-sync (IDA):
IDA synchronization with a REVEN trace requires Axion to connect to the machine running IDA (port 9100 by default). Here again, a VPN may prove useful.
Installing REVEN v2
Follow the steps below to install REVEN v2:
-
Unwrap the REVEN v2 package. You can choose to install it anywhere you want on your file system. Change your current directory to the root of the unwrapped package.
-
Install the required system dependencies:
./install.sh
This will ask for yoursudopassword in order to install the system dependencies.NOTE: If you have a separate privileged account, then it's not a problem to run
install.shwith this account, since the install process does not depend on any particular user-specific variable. -
Add your user to the group
kvm:
sudo adduser your_user kvm -
Install the REVEN environment:
./start.shNOTE: You may encounter an exception from the
/usr/lib/python3.5/weakref.pyfile. It does not affect the successful completion of the installation, see the associated FAQ entry for more information. -
Adjust the installation settings:
- Edit the
settings.pyfile to fit your needs.- You'll probably want to touch the
QUASAR_SYMBOL_SERVERSvariable. - By default, the
QUASAR_ROOTwill point in your home directory (~/Reven2). See the storage requirements above for more information.
- You'll probably want to touch the
NOTE: user-wide parameters can also be set in a ~/.config/tetrane/quasar.py
file. It's the recommended place for QUASAR_SYMBOL_SERVERS and custom
QUASAR_ROOT, QUASAR_QEMU_SCAN_PATH, QUASAR_ARCHIVES_PATH,
QUASAR_SYMBOL_STORE, and QUASAR_USE_VNC.
Using REVEN v2 for the first time
REVEN v2 comes with new services accessible through a new web interface named REVEN Project Manager to manage Virtual Machines, scenarios and associated data, and to launch Axion on those scenarios.
Local use from the REVEN host
When locally logged in the REVEN host, use REVEN v2 as follows:
- Launch the Project Manager services, with the following command at the root of the installation directory:
./start.sh
- Then point your favorite web browser to the Project Manager's homepage:
http://your-reven-host:8880/
NOTE: The Project Manager will run X programs for you to record a scenario, or to access the Axion GUI.
Remote use
Through web browser
The simplest way to use REVEN v2 on a remote server, is to set the
QUASAR_USE_VNC setting to True. This will make everything, from the virtual
machines to Axion, to be accessible directly from the browser.
Don't forget to restart the Project Manager after changing this setting.
This feature is known to have a few limitations by design:
- Copy-pasting will work with Axion sessions, but not with VM sessions, since this would require QEMU or VirtualBox to have hooks in the OS they virtualize. This is the same for the "Remote resizing" feature.
- Some keyboard shortcuts may be catched by your desktop environment or web browser before being sent to VNC. This can usually be worked around using the "Extra keys" in the NoVNC UI or reconfiguring your Axion shortcuts.
With X forwarding
When not locally logged in the REVEN host, but working from a remote client, use REVEN v2 as follows:
- Connect to the REVEN v2 host through SSH with X forwarding enabled:
ssh -Y your-login@your-reven-hostThen use the Project Manager as you would locally.
- Launch the Project Manager services, with the following command at the root of the installation directory:
./start.sh
- Point your favorite web browser to the Project Manager's homepage:
https://your-reven-host:8880/
NOTE: in this configuration, other users should not use your REVEN v2 instance as X applications would be redirected to your display.
They will need to launch their own instance of the Project Manager (See next section).
Stopping REVEN v2
Simply run ./stop.sh at the root of the installation directory, with the same user
that launched start.sh.
Troubleshooting
If you have any trouble somewhere, don't hesitate to take a look at the logs
located in ~/Reven2/<version>/Logs and contact support@tetrane.com for any help.
Moving a REVEN v2 installation directory
If you move the installation directory after running the first start.sh, you'll have
to manually reset the QUASAR_REVEN_ROOT_PATH variable in the settings.py file.
Installing the REVEN v2 Python API
Please refer to the dedicated installation document.
FAQ
What is Quasar?
Quasar is the component implementing the project manager.
The Project Manager is REVEN v2 Web user interface to manage Virtual
Machines, scenarios and associated data, and to launch Axion on those scenarios.
Where do I change the settings?
Per user settings
Some Project Manager settings can be changed at the user level, for
all the versions installed for this user, in the file ~/.config/tetrane/quasar.py.
This file can store settings common to all the user's versions of the Project
Manager, such as the list of symbol servers or some storage paths. It is created
the first time a Project Manager is started for the user.
IMPORTANT: Remember to run stop.sh then start.sh for every running
version of the Project Manager in order to take new settings into account.
Per instance settings
Some Project Manager settings can be changed at the instance level, at
the root of the installation directory, in the file settings.py. It is created
the first time an instance is started.
IMPORTANT: Remember to run stop.sh then start.sh in order to take new
settings into account.
What settings may I change?
Here are some important settings you may want to tune:
QUASAR_ROOT: this is where most of the files will be stored. It is by default in your home directory (~/Reven2), but you may change it to use a custom path.QUASAR_QEMU_SCAN_PATH: this defines where the QEMU Virtual Machine QCOW files will be scanned for registration in the Project Manager. Since this will be scanned recursively, be careful not to put too large a file tree in there, or some Project Manager pages will become very slow.QUASAR_SYMBOL_STORE: this is the symbol cache that REVEN will use for storing PDB files it downloads. If this path is attached to a slow mount point, such as a centralized SSHFS mount point, you may experience latency in the Axion GUI. However, it may be a good idea to share this path with others, since everyone will take advantage of the cache.QUASAR_UWSGI_PORT: port the Project Manager web server will listen to.
What if I want to run multiple instances on the same machine?
You can run multiple instances of Project Manager on the same machine, as long as you set the multiple web interfaces to listen on different ports. You have two solutions to do that:
- Give the port number to
start.shas its first argument:
./start.sh 4000will make the web interface accessible on port 4000. - Set the port number permanently in one of your setting files, with the
variable
QUASAR_UWSGI_PORT, depending on your deployment configuration.
How to use REVEN behind a reverse-proxy?
It's no problem running a REVEN instance behind a reverse-proxy, as long as you follow those recommendations:
- (optional) Change the
QUASAR_UWSGI_PORTto a custom value (e.g. 8888) - Set the
QUASAR_USE_VNCvalue toTrue - Set the
QUASAR_WEBSOCKIFY_PORTto a fixed value (e.g. 6080) - Set the
QUASAR_WEBSOCKIFY_PUBLIC_PORTto the proxied value (e.g. 80)
Here is an example of a working nginx configuration using the above example values:
server {
    listen 80;

    location / {
        proxy_pass http://127.0.0.1:8888/;
        proxy_http_version 1.1;
        proxy_set_header X-Forwarded-For $proxy_add_x_forwarded_for;
        proxy_set_header X-Forwarded-Proto $scheme;
        proxy_set_header Host $server_name;
        proxy_set_header Authorization ""; # Ensure we clear the Authorization header for DRF.
    }

    location /websockify {
        proxy_pass http://127.0.0.1:6080/websockify;
        proxy_http_version 1.1;
        proxy_set_header Upgrade $http_upgrade;
        proxy_set_header Connection $http_connection;
        proxy_read_timeout 1800s; # Default is 60s, which is really low in this use-case.
    }
}
I am getting exceptions from /usr/lib/python3.5/weakref.py, is it an issue?
Exception ignored in: <function WeakValueDictionary.__init__.<locals>.remove at 0x7f2bc24c40d0>
Traceback (most recent call last):
 File "/usr/lib/python3.5/weakref.py", line 117, in remove
TypeError: 'NoneType' object is not callable
This behavior is not an issue. It is a well known exception (Python issue 29519) that affects the version of Python used in Debian 9 Stretch. When encountered, it may leak some memory but won't impact the successful completion of the operations.
A patch is available, but since it should be applied to /usr/lib/python3.5/weakref.py, which is a system file, we don't apply it ourselves.
diff --git a/usr/lib/python3.5/weakref.py b/usr/lib/python3.5/weakref.py
index c66943f02e24..3e1fb8158069 100644
--- a/usr/lib/python3.5/weakref.py
+++ b/usr/lib/python3.5/weakref.py
@@ -53,7 +53,7 @@ def __init__(*args, **kw):
         args = args[1:]
         if len(args) > 1:
             raise TypeError('expected at most 1 arguments, got %d' % len(args))
-        def remove(wr, selfref=ref(self)):
+        def remove(wr, selfref=ref(self), _atomic_removal=_remove_dead_weakref):
             self = selfref()
             if self is not None:
                 if self._iterating:
@@ -61,7 +61,7 @@ def remove(wr, selfref=ref(self)):
                 else:
                     # Atomic removal is necessary since this function
                     # can be called asynchronously by the GC
-                    _remove_dead_weakref(self.data, wr.key)
+                    _atomic_removal(self.data, wr.key)
         self._remove = remove
         # A list of keys to be removed
         self._pending_removals = []
Annex I: deployment overview
REVEN v2 Project Manager - Quick start
REVEN v2 comes with new services accessible through a Project Manager web interface to manage Virtual Machines, scenarios and associated data, and to launch Axion on those scenarios.
Project Workflow
Once REVEN v2 has been installed, the overall workflow of a Reverse Engineering project goes as follows:
- Create and configure the Virtual Machine (VM) of the project.
- Get OSSI information.
- Configure and record a scenario.
- Replay the scenario and generate analysis data.
- Analyze the scenario with Axion GUI.
Monitoring REVEN v2 tasks and sessions
Using the Project Manager, you can monitor:
- Ongoing tasks such as:
- Replaying a scenario
- Preparing OS-specfic information related to a VM
- Sessions such as:
- Launched REVEN servers
- Launched Axion GUI
Learn more about Tasks & Sessions.
Learn more about exporting and importing scenarios.
Creating and configuring Virtual Machines for your project
With REVEN v2, you can build RE projects where analyzed scenarios are recorded from Virtual Machines(VMs), either VirtualBox or QEMU. Although choosing one vs the other will depend on your work habits, we recommand:
-
Using VirtualBox when:
- VM configuration and setup is a heavy job.
- Some specific hardware must be studied.
-
Using QEMU in all other cases to experience replay high fidelity.
IMPORTANT NOTE: replayers do NOT support VMs with too much RAM (strictly more than 3072MB for QEMU and 2048MB for Vbox). DO NOT record scenarios with more than these limits of RAM or the replay will fail.
Records can be started from VM snapshots. The Project Manager allows some control over those snapshots. Here are some keys to understand what's happening.
Introducing VM snapshots
Both QEMU and VirtualBox VMs use two kinds of snapshots:
- Disk snapshots: contain no more than the content of the machine local filesystem. Restoring a disk snapshot brings you to the VM boot, which might not be convenient when recording a scenario.
- Live snapshots: contain the full saved state of a running VM, including the RAM, CPU state, and filesystem. Restoring a live snapshot brings you to the exact VM running state where you took it.
NOTE: in case of modifications in the VM hardware parameters, a live snapshot will probably become unrecoverable.
Please refer to the dedicated VirtualBox and QEMU pages for more information on how to work with each system's snapshots.
Disk snapshot statuses
Disk snapshots can have the following statuses in the Project Manager, relating to OSSI availability:
: Prepared, means the OS Specific Information (OSSI) has been extracted from the snapshot, namely the filesystem content and kernel information.
: Inherited, means the snapshot "inherits" the OSSI of a parent snapshot. NOTE: If the current snapshot contains new binaries compared to its parent snapshot, OSSI may not be available for these binaries in the Analysis stage. Should you need this OSSI, launch a Prepare operation on the current snapshot.
: Not prepared, means no Prepare operation has occured for this snapshot. Therefore, no OSSI is available for this snapshot. Without OSSI, binary and symbol names will not be available in the Analysis stage.
Optimizing the VM system for analysis
In order to optimize scenario recording and replay performance, you will need to remove system features that are not useful to your scenarios.
As REVEN will record the entire system execution, the following VM system configuration steps will optimize the virtual machine characteristics and scenario recordings:
- Limit the virtual machine RAM to reduce disk footprint.
- Disable any non essential system features so as to reduce noise in the scenario recording, hence the replay duration, the trace size and complexity, which makes analysis easier and faster.
Microsoft Windows system preparation
On Windows systems, the following preparation steps are required to improve REVEN performance and to make all its features fully operational.
- Disable desktop graphical effects.
- Disable unnecessary services.
- Disable KPTI protections (required to get OS Specific Information (OSSI) such as symbol names).
- Disable the CompactOS option (required for performance and to get OSSI).
Disabling unnecessary services
Regarding Windows 10 VMs, the REVEN package comes with a sample Powershell script designed to lighten a Windows 10 system, so as to greatly improve its performance and reduce the size of REVEN traces. This script is available from the Downloads page of the Project Manager.
IMPORTANT: Please note that this script is provided to REVEN's users as-is,
without any guarantee, as a convenient tool. Therefore, it must be
considered for what it is - an example. It is strongly recommended to backup
any VM before running the script on it. Besides, the script may require
modifications to fit your specific configurations. For example, non-English VMs
may require some translation in the script, such as administrator to
administrateur in a French VM.
Before using the script, apply the following configuration:
- Disable Windows Defender and optionally the firewall:
- As an Administrator, launch
gpedit.msc. - Navigate to "Local Computer Policy\Computer Configuration\Administrative
Templates\Windows Components\Windows Defender\Turn off Windows Defender" and
set the
Enabledradio button. - Navigate to "Local Computer Policy\Computer Configuration\Windows
Settings\Security Settings\Windows Firewall with Advanced Security" and
set it to
Off.
- As an Administrator, launch
On Windows 10, in an administrator Powershell console, you can:
- Get help about the script's capabilities and usage:
> Get-Help windows10_lightener.ps1
- Run the script to disable a maximum of services:
> Set-ExecutionPolicy Unrestricted
(confirm)
> windows10_lightener.ps1 -All
IMPORTANT: AV disablement by this script is not persistent after a VM reboot, which is is why we recommended disabling it via groups policies above. Alternatively, the script may be executed after each reboot to disable the AV services again:
> Set-ExecutionPolicy Unrestricted
(confirm)
> windows10_lightener.ps1 -DisableAV
Manually disable the following services:
- Print spooler
- DPS
- Themes
- Workstation (SMB protocol)
In order to enable networking, reactivate the following services:
-
Windows Event Log
-
Network Connections
-
Network List Service
-
Run the script to disable basic services only:
> Set-ExecutionPolicy Unrestricted
(confirm)
> windows10_lightener.ps1 -Basic
Disabling the KPTI protections
KPTI (Kernel Page-Table Isolation) protections were introduced with the meltdown patches. If KPTI protections are enabled, OSSI will be available only on ring 0 or admin processes.
Microsoft provides the following steps to disable KPTI protections:
reg add "HKEY_LOCAL_MACHINE\SYSTEM\CurrentControlSet\Control\Session Manager\Memory Management" /v FeatureSettingsOverride /t REG_DWORD /d 3 /f
reg add "HKEY_LOCAL_MACHINE\SYSTEM\CurrentControlSet\Control\Session Manager\Memory Management" /v FeatureSettingsOverrideMask /t REG_DWORD /d 3 /f
shutdown -r
Disabling the CompactOS Windows 10 option
On Windows 10, the CompactOS feature lets you run the operating system
from compressed files to maintain a small footprint. However, this feature
is not compatible with the Prepare stage of the REVEN workflow, which is
required by the OSSI features.
Besides, uncompression routines may unnecessarily increase a scenario's trace size.
Therefore it is recommended to check the status of the Compact OS feature on a Windows 10 VM with the following command issued as the Administrator user:
> Compact.exe /CompactOS:query
The system is in the Compact state. It will remain in this state unless
an administrator changes it.
>
If the CompactOS feature is active, it is recommended to disable it:
> Compact.exe /CompactOS:never
Uncompressing OS binaries /
Completed uncompressing OS binaries.

15483 files within 11064 directories were uncompressed.
>
If necessary, it can be later re-enabled:
> Compact.exe /CompactOS:always
Completed Compressing OS binaries.

15483 files within 11064 directories were compressed.
4,454,521,157 total bytes of data are stored in 2,620,926,932 bytes.
The compression ratio is 1.7 to 1.
>
Linux systems optimizations
On Linux systems, common optimizations include:
- Disabling Xorg server when not needed.
- Disabling the console framebuffer if not needed. For example, on Debian
systems, in file
/etc/default/grub, add the line:
GRUB_TERMINAL=console
- Disabling any unwanted background service.
VirtualBox Virtual Machines
The REVEN server makes use of VirtualBox virtual machines to record the execution of the scenarios you want to analyze. This section describes how to setup a virtual machine that will be suitable for scenario recording.
Pre-requisites
IMPORTANT: VirtualBox is installed during the REVEN server installation process.
IMPORTANT: Should you need some advanced system configuration, such as
dedicating a USB device to a VM, you will have to manually add the Linux
user running REVEN to the Linux group vboxusers. If reven_user is the user
login, this can be done using the command line sudo adduser reven_user vboxusers.
NOTE: Managing remotely a VirtualBox machine may be done through a SSH connection with X-Forwarding enabled or with solutions such as phpVirtualbox or remotebox. We will not document them here.
Creating VirtualBox VMs for scenario recording
- Create a virtual machine in VirtualBox. Please refer to VirtualBox's online documentation.
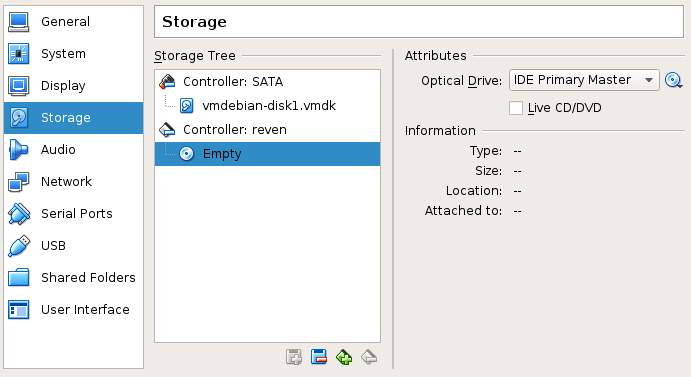
- Add an IDE adapter to the VM configuration (or make sure it exists). This can be done through the Storage section of the virtual machine settings:
- Set the IDE adapter name to
reven. - Set it as CD-ROM / primary master device.
- Setup the
Systemsettings as follows: - In the
Processortab, set the number of processors to 1.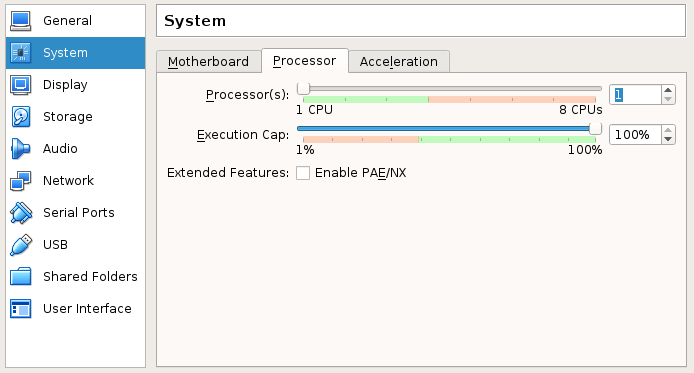
- In the
Accelerationtab:- Set the
Paravirtualization interfaceto None. - Check all boxes of
Hardware Virtualization.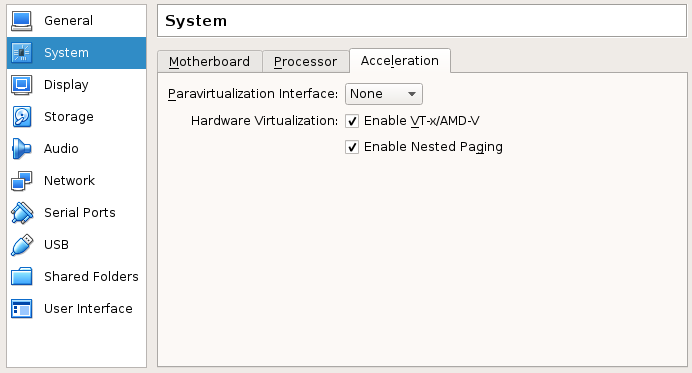
- Set the
- Setup the
Audiosettings either disabled, or enabled with the ICH AC97 audio controler selected. Otherwise, the Virtual Machine may not start. - Install the Microsoft Windows or Linux guest OS of your choice on the virtual machine.
WARNING: Make sure to remove any software that may communicate with
the VirtualBox hypervisor from the guest. Intrusive software such as
VirtualBox's Guest additions (which provides extended features like drag
and drop, clipboard sharing and full resolution display) may lead to unhandled
hypervisor behavior, and the recorded scenario will not be properly handled
by REVEN.
VirtualBox snapshots
For a given VM, the Project Manager will show you a single list of VirtualBox snapshots to record scenarios from.
Disk snapshots
This is the equivalent of taking a snapshot while the VM is shut down, or discarding its saved state when taking a snapshot on a running VM.
Live snapshots
This is the saved state you get when you shut the VM down choosing Save state, or when you take a snapshot on a running VM.
Typical VirtualBox usage
We recommend the following approach to prepare a VirtualBox snapshot that will be used for a scenario recording.
In the VirtualBox GUI:
- Create and setup the VirtualBox VM.
- Install software & configuration required by your scenario in the VM.
- Run operations required in the VM before the scenario recording but that need not be recorded.
- Take a snapshot of the VM.
- Shutdown the VM.
In the REVEN Project Manager:
- If the VM has previously been registered, simply refresh the list of snapshots for the VM.
- If the VM has not been registered yet, simply register it. Its snapshots will be automatically known by the Project Manager.
QEMU Virtual Machines
Pre-requisites
IMPORTANT: QEMU is installed during the REVEN server installation process.
The next sections introduce useful QEMU notions to work with REVEN:
- KVM vs Emulated QEMU VMs.
- Disk and live snapshots in QEMU.
KVM vs Emulation
There are two ways to run VMs with QEMU: either using KVM (virtualized mode) or emulated. The former is much faster, but the latter is required when recording. Saved VM states cannot be shared between the two modes, but disk snapshots can.
In the Project Manager's VM view you can select either modes, but when recording a scenario only the emulation mode is available.
KVM mode is convenient when installing software or OSes. See typical workflow below.
For a complete documentation on QEMU tools, please refer to QEMU's online documentation.
How do snapshots work in QEMU
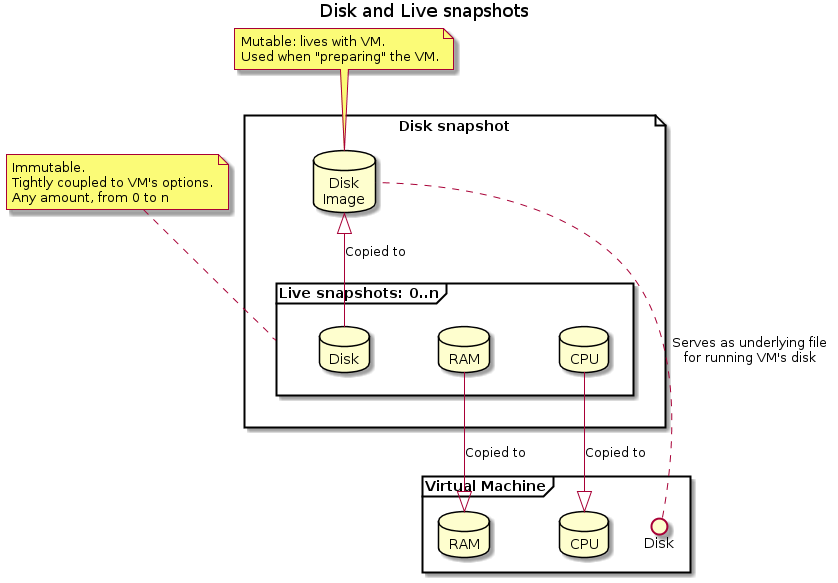
IMPORTANT This section is crucial: REVEN uses the native disk / live snapshot mechanism from QEMU which might differ from what users expect.
There are two types of snapshots available in the qcow file format:
- Disk snapshots represent the state of a disk, and may be organized in a tree structure to save disk space.
- Live snapshots represent the full state of a VM, including memory, cpu registers and disk. They are stored inside a disk snapshot, and are what most users expect.
The two are used in conjunction to provide various functionalities:
- Live snapshots allow the user to store the full state of a VM:
- Loading a live snapshot will allow restoring a VM that is booted.
- These are tightly coupled to the options the VM has been started with: not selecting the right options will prevent snapshots from loading. These options include "kvm", "network", or any custom option.
- They are immutable by design
- Disk snapshots contains the disk only:
- They are mutable: they live with the VM
- Loading a live snapshot will alter the disk snapshot, by restoring it to the saved state. Any modification is lost.
- Starting a VM from a disk snapshot will, by design, require a full boot.
- They can be linked to parent disk snapshots, to limit disk usage on the host. Note that altering a parent snapshot may render children unusable!
Adding QEMU VMs for scenario recording
REVEN will search for .qcow2 files in the directory identified as
QUASAR_QEMU_SCAN_PATH in your settings (by default, ~/VMs).
- Copy or create a disk image to the
QUASAR_QEMU_SCAN_PATH. You need access to a console to the server to do so. - Create an initial disk snapshot which will serve as a base.
You can then boot the VM and create a first live snapshot.
Working with QEMU snapshots in REVEN
IMPORTANT NOTE: QEMU replayers do NOT support VMs with strictly more than 3072MB of RAM. DO NOT try to record with more than 3072MB of RAM or the replay will fail. The Project Manager web interface will prevent you from doing that.
In the Project Manager:
- You register a QEMU VM and corresponding disk snapshots are automatically
linked. Besides, both disk and live snapshots can be created.
- Disk snapshots (usually generated with QEMU
qemu-img) can be taken through the Take snapshot button on the VM list page. NOTE: disks snapshots imply booting the VM, which can be quite long with QEMU without KVM (several minutes for a Windows 10 VM). - Live snapshots (usually generated with QEMU
savevm) can be taken through the Manage button on the VM list page, then in the Running the VM section. You can also access them on the record page of a scenario.
- Disk snapshots (usually generated with QEMU
QEMU snapshots options
By default, when you start a snapshot, it is launched with the VM options (RAM size, network, custom QEMU options) that were provided during the Register VM step. You can override these options for this specific snapshot in the Running the VM section. Overridden options for a snapshot will be applied when starting the VM on this snapshot. You can restore an option to its VM value by unchecking the checkbox associated to this option.
Typical QEMU workflow example
To illustrate the previous explanations, here is how users can typically work with QEMU to configure and prepare a VM before recording a trace:
In the Project Manager VM Manager
- Register an existing QEMU VM.
- Create a disk snapshot for a new project from a clean parent.
- Boot this snapshot with KVM enabled.
- Install required software (using the CD-Rom mounting feature to upload files to the VM).
- Properly shutdown the VM (on Windows, using
Shift+Clickon theShutdownoption is required, otherwise the VM is only hibernated!). - You can now
Preparethe snapshot: all required binaries are present on the disk. - Boot the VM again in emulated mode, i.e. with KVM disabled, with the required options for recording.
- Run operations required before the scenario recording but that need not be recorded.
- Take a live snapshot.
WARNING: live snapshots taken with KVM enabled can not be used for recording in REVEN Project Manager with QEMU.
Then, in the Scenario Manager
- Create a new scenario, selecting the previously created disk snapshot.
- Load the previously created live snapshot.
- Record your trace.
- Force shutdown the VM.
NOTE: at this point, the disk snapshot contains an OS that didn't properly shutdown: it is usually not an issue because restoring the live snapshot will overwrite this state, but booting the VM from the disk snapshot itself will likely trigger any disk verification process the guest OS may have.
NOTE: you can save live snapshot during scenario creation as well, if necessary.
NOTE: for simpler situations, you might have a few live snapshots in emulation mode for various use cases: one with network, one without, etc.
Help! My snaphost doesn't load!
There are a few situations that will prevent a snapshot from loading. In all cases, you can go to the list of Sessions in the Project Manager to get the log of what went wrong. Several checks can be done, depending on the type of snapshot concerned.
Live snapshots
- Make sure the selected options match that of the live snapshot, including kvm mode and custom options. As a convenience, the snaphosts's name contains a summary of common ones.
Disk snapshots
- Has the VM been properly shutdown? (
Shift + ClickonShutdownin windows) - Have the parent disk snapshot been modified? If so, children snapshots are unusable
Note that in some cases your disk snapshot may become corrupted leading to the error Image is corrupt; cannot be opened read/write when launching QEMU. It can sometimes occur when having heavy disk I/O or killing QEMU.
To assert the level of corruption of your snapshot you can use the command qemu-img check /path/to/your/snapshot.qcow2.
A possible fix is to ask qemu-img to fix the corruption qemu-img check -r all /path/to/your/snapshot.qcow2.
Working with OS Specific Information (OSSI)
One very important aspect of analyzing a scenario's trace involves mapping the low level transitions in the trace to higher level OS Specific Information (OSSI) such as binary names and symbol names.
VM Requirements
- Supported OS: Windows 64bits
- CompactOS option: disabled. If the CompactOS option is enabled, the VM
Prepareprocess required to retrieve the binary information will fail. - KPTI protections: disabled. If KPTI protections are enabled, OSSI will be available only on ring 0 or admin processes.
- CompactOS option: disabled. If the CompactOS option is enabled, the VM
See the VM Creation page on how to disable these options.
Obtaining OSSI for a scenario
For Microsoft Windows systems, OSSI can be derived from binaries and Program Data Base files, also known as PDBs.
Therefore, obtaining OSSI for a scenario involves:
- Defining remote PDB sources for REVEN.
- Preparing the VM snapshot used for the scenario.
- Downloading PDBs.
Defining PDB sources
Local PDB store
When deriving OSSI, REVEN v2 can look up PDBs from a local PDB store. This
store is defined in the settings.py or quasar.py configuration files:
# The storage for symbol files (PDBs), to pass to REVEN
QUASAR_SYMBOL_STORE = str(Path.home() / Path(".local") / Path("share") / Path("reven") / Path("symbols"))
The store is common to all the scenarios of a REVEN v2 installation.
The default store path is ~/.local/share/reven/symbols.
The PDB store structure respects the following format:
<PDB filename>/<GUID><AGE>/<PDB filename>
example:
 E1G6032E.pdb
 └── 226C50445B4C4416AF88ED42E0BA63221
     └── E1G6032E.pdb
acpi.pdb
 └── 3F854976E9FE4734BBB19FD05B5543D11
     └── acpi.pdb
d3d10warp.pdb
 └── 257F5B0C541C4853B1D1CCC44655DB271
     └── d3d10warp.pdb
fltMgr.pdb
 └── 620A988036C34BAFAD3FA05B3C5E27FF1
     └── fltMgr.pdb
hal.pdb
 └── 81C1AF690083498BA941D5EC628CDCF41
     └── hal.pdb
i8042prt.pdb
 └── 2514B510EC2475DF4224FA4436871A131
     └── i8042prt.pdb
ndis.pdb
 └── C3E365B8B9DA0007DB598464D3B858CC1
     └── ndis.pdb
ntdll.pdb
 └── 4E4F50879F8345499DAE85935D2391CE1
     └── ntdll.pdb
ntfs.pdb
 └── EFB9533DBFF64A4886FB2D975BDBB1101
     └── ntfs.pdb
ntkrnlmp.pdb
 ├── 0DE6DC238E194BB78608D54B1E6FA3791
 │   └── ntkrnlmp.pdb
 ├── 23CA40E78F5F4BF9A6B2929BC6A5597D1
 │   └── ntkrnlmp.pdb
 ├── 2980EE566EE240BAA4CC403AB766D2651
 │   └── ntkrnlmp.pdb
 └── 83DB42404EFD4AB6AFB6FA864B700CB31
     └── ntkrnlmp.pdb
NOTE: Modifying the configuration files requires stopping and starting the Project Manager.
Remote PDB servers
PDBs can be downloaded:
- Explicitly from the Program Manager .
- Transparently while:
- Preparing a VM Snapshot's OSSI.
- Analyzing a scenario in Axion.
PDBs are downloaded from a configured list of PDB servers, based on the binaries present in a VM's Snapshot file system.
The list of PDB servers is defined in the settings.py or quasar.py
configuration files. For example:
# The list of symbol servers to pass to REVEN
QUASAR_SYMBOL_SERVERS = [
    "https://msdl.microsoft.com/download/symbols",
]
By default, the list is empty.
Downloaded PDBs are stored the local PDB store.
NOTE: Modifying the configuration files requires stopping and starting the Project Manager.
Preparing a VM snapshot
The Prepare task will:
- Extract the VM snapshot's file system.
- Build kernel specific information used to derive memory mappings.
In the Project Manager,
- Browse to the VM manager tab, then to a VM in the list, then to a snapshot.
- Click on the
Preparebutton. - You can monitor and control the
Preparetask in theTasks & Sessionstab.
WARNING:
- Extracting a VM's file system requires about three times its size of available disk space.
- For a Microsoft Windows 10 VM, the file system is about 40GB large, meaning you will need about 120GB of free space to perform that operation.
- Binary files whose path is longer than 256 characters will not be extracted.
Learn more about Snapshots statuses
after a Prepare operation.
Downloading PDBs
The downloading of PDBs can be done in 3 ways:
-
Explicitly from the Program Manager:
- Browse to the VM manager tab, then to a VM in the list, then to a snapshot.
- Click on the
Download PDB filesbutton. - You can monitor and control the
PDB downloadtask in theTasks & Sessionstab.
-
Transparently while:
- Preparing a VM Snapshot's OSSI.
- Analyzing a scenario in Axion.
If Enable live PDB download in the scenario's analysis page is checked, each
time a new binary is accessed during the analysis, REVEN will try to download his
PDBs if not in the local PDB store. Be careful, depending on the
network and the size of the PDB, the downloading could last from some seconds to minutes.
Axion will be freezed during this time.
- Manually, you can use the
bin/rabin2tool provided with REVEN v2.
RABIN2_PDBSERVER="<pdb server>" RABIN2_SYMSTORE="<path to the local PDB store>" bin/rabin2 -PP "<binary file>"
Creating a new scenario
Once you have VMs and Snapshots all set up, you are ready to create new analysis scenarios.
Creating a scenario involves the following steps:
- Selecting a snapshot to start from, naming and describing the scenario.
- Listing files that must be loaded on CD-ROM before the scenario recording.
- Recording the scenario:
- Starting the VM / Snapshot.
- Starting recording.
- Performing scenario operations in the VM.
- Stopping recording.
- Stopping the VM / Snapshot.
More on scenario recording
REVEN v2 currently supports manual recording, with start and stop operations explicitly performed by the user.
Recording a scenario in QEMU
With QEMU, start and stop operations are triggered via the Web user interface buttons.
By default, for a record, the VM is launched with the options values of the selected snapshot (ram size, network, custom QEMU options) It is possible to override snapshot options for this specific record before launching the VM. In the Web user interface there are checkboxes and fields that allow to modify the ram size, enable or disable the network or add (QEMU) custom options.
Recording a scenario in VirtualBox
With VirtualBox, start and stop operations are triggered via custom keys, from within the VM:
Inside the VM:
- Type F9 to enable custom keys which are used to start or stop a recording.
- Type F6 or Enter to start recording.
- Type F7 to stop recording. This also stops the VM and closes VirtualBox.
NOTE: Custom keys can be disabled typing F10.
Replaying a scenario
Recording a scenario saves a minimum set of events which are necessary to later reproduce its complete execution trace. The goal here is to minimize the recording overhead.
The Replay stage allows to:
- Retrieve the whole set of events that occured during a scenario.
- Compute new data from this set of events to provide advanced analysis features.
Several sets of data, called resources in the Project Manager, can be replayed from a recording, each corresponding to some analysis feature:
- Trace data
- Memory History data
- Strings data
- Backtrace data
- Binary and symbol indexing data
- Framebuffer data
Learn more about Feature and Resources.
For QEMU scenario only, the replay page allows to add custom options to the replay command (for advanced users only). By default, these options have the same value than the ones used during the record. The ram size is not editable at this step since the replay requires the same amount of ram as the record. When a resource has been generated with custom options, all remaining resources have to be generated with these same options. If you don't want to use custom options anymore, then you should remove the already generated resources that used custom options.
Replaying a scenario will take minutes to hours depending on:
- The REVEN server hardware resources.
- The scenario duration and computing intensity.
- The number of features replayed.
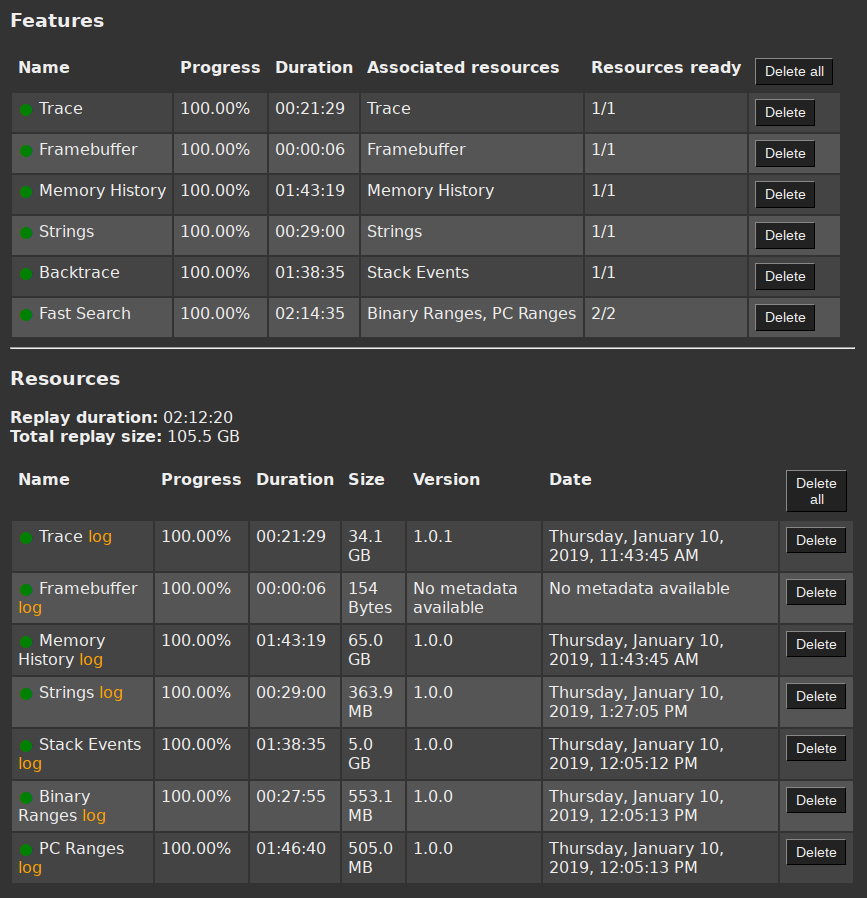
The screenshot below shows the Replay statistics for a QEMU scenario with 2.3 billions transitions on a server equipped with an Intel(r) Xeon(r) CPU E5-2643 v4 @ 3.4GHz and 264GB RAM.
NOTE: The total replay duration is less than the sum of all resource replays since some of them are run in parallel.
Import & export a scenario
Export
When a scenario is recorded, you can export the scenario to share it with other REVEN users or archive it to make space on your disk.
Note that the scenario is not automatically deleted after the export task succeeds (this allows you to export your scenario for others without deleting it). If you want to make space, you need to delete it manually.
Exported scenarios are stored in an archive folder which is
user-definable in the project manager settings file via the variable QUASAR_ARCHIVES_PATH (refer to the settings file for the details of available compression types).
A scenario can only be exported once in your archive folder. If you try to export an already exported scenario, it will replace the older archive.
You cannot export a scenario while recording, replaying, importing or exporting it.
The button to export a scenario can be found in the REVEN project manager web interface, in the Scenario details page.
Exporting my scenario
You will need to choose what you want to export before launching the export task:
- the record: it is mandatory, you cannot export a scenario without a record included in the archive. Without a record, we cannot replay resources necessary for the analysis.
- the replay: resources generated by a replay are optional. They can be regenerated after the import. We do not recommend keeping them since they add significant overhead to the archive size, which also increases the time necessary to export it.
- the light ossi: It is highly recommended to include the Light OS-specific information. If you don't include them, you won't be able to retrieve OSSI (like symbols) when you will import the archive.
- the light PDBs: Light PDBs contain only PDBs needed for the scenario then they are pretty light. However, even if you do not include them in the archive, you should be able to download them from the location you got them originally.
- the user data: The user data folder is a user folder that contains files useful for the scenario (scripts, readme, ...) you would like to share or retrieve with your imported scenario.
The archive will also always include scenario information (name, type, os, archi, ...) and version information to be sure we can import it.
Importing a scenario
When you have a scenario archive, you can import it in your REVEN project manager. It will automatically extract the archive, create the scenario and add it to your scenario list.
An imported scenario cannot be record again. A scenario correspond to a specific record you can edit the description of, replay, analyse and delete.
The scenario will be labelled as Snapshot-less scenario. Since the scenario is imported and an imported scenario already has a record, there is no need for a VM. Therefore the scenario is not and cannot be bound to a VM and a snapshot.
You cannot import a scenario already imported in your REVEN project manager.
Some resources are immutable in a Snapshot-less scenario, this means they cannot be regenerated or deleted (if you want to delete them, delete the entire scenario).
Indeed, resources which depend on snapshot information (filesystem, kernel description) cannot be retrieved since there is not snapshot bound to an imported scenario.
NOTE: Light OSSI are immutable resources since the feature depends on the snapshot. This is why you will not have any OS-specific information like symbols or binaries if you do not export them beforehand.
To import a scenario, a button on top of the scenario list in the REVEN project manager is available. You will be able to choose an archive from your archive folder.
As soon as you start importing a scenario, you will see it in the scenario list. However, as long as the scenario is in the process of being imported, all actions on the scenario will be disabled.
Axion - User guide
Axion is REVEN v2 GUI for scenario analysis. It helps reverse-engineer complex programs and situations.
Installing Axion
Axion is comprised in the REVEN v2 package for the Debian 9 Stretch x64 servers. Please refer to the REVEN v2 installation guide for further guidance on deploying the package.
Using Axion
Axion can be launched from the Project Manager REVEN v2 web GUI, on scenarios that have appropriate data available for analysis. Please refer to the REVEN v2 Project Manager User Guide for further guidance on preparing a scenario for analysis by Axion.
Core Analysis views
Axion provides several views to analyze a scenario.
- Trace view
- CPU view
- OS Specific Information (OSSI)
- Backtrace view
- Search view
- Memory - Hexdump view
- Memory - Memory history view
- Memory - Physical history view
- Framebuffer view
Tool views
- Logs
- Bookmarks
Visit the Axion Views page for more details on how to use each view.
Plug-ins
OSSI
One very important aspect of analyzing a scenario's trace involves mapping the low level transitions in the trace to higher level OS Specific Information (OSSI) such as binary names and symbol names.
Currently, only Windows 64bits is supported.
More information about OSSI environment setup can be found here.
In Axion, OSSI is provided in the following views:
Binary information
Binary information is all information related to a segment of memory that is mapped into a process address space. Most of the time, a segment of memory is a binary loaded in memory but it can be a stack, a heap, a part of memory allocated by a process, etc.
A segment of memory is valid for a process and defined by a base address (=start address), a size and a name.
Information is derived from the in-memory OS process map.
If the binary information related to an address is not available, unknown will be displayed. The cause of an unknown information can be that:
- The binary mapping was not found in the
_PEB_LDR_DATAstructure of the running process. - The execution of some code on the heap, on the stack or after a copy in memory.
- The VM used to record the scenario has the
KPTI protectionenabled.
Symbol information
Symbols are part of binary information. A symbol is linked to a memory segment and it is defined by a relative virtual address (RVA) and a name.
A RVA is an offset from the base address of the memory segment. Using a RVA instead of a virtual memory address allows to be independent on where the memory segment is mapped in the process address space.
The sources of symbol information are:
- The binary files.
- The PDB files.
If the symbol related to an address is not available, unknown will be displayed.
Symbol name format
The following example explains what will be displayed in various situations.
         Process Address
             Space
        cr3 = 0x078c0000

         |             |
         |             |                     Example.exe
         |             |                 base address = 0x400000
         |             |
         |             |                                      rva     symbol
 0x400000|-------------|                    .-------------.   0x0      nil
         |             |                    |             |
         |             |                    |             |
         |             |                    |             |
         | Example.exe |                    |-------------|   0x300    Sym1
         |             |         =>         |             |
         |             |                    |             |
         |             |                    |-------------|   0x1200   Sym2
         |             |                    |             |
         |             |                    |             |
         |             |                    |             |
         |             |                    |             |
 0x402000|-------------|                    '-------------'   0x2000
         |             |
         |             |
         |             |
         |             |
Possible formats for a symbol's name are:
[0x400000, 0x400300[=>Example.exe_<rva>.0x400300=>Sym1.]0x400300, 0x401200[=>Sym1+0x<offset from rva>.0x401200=>Sym2.]0x401200, 0x402000[=>Sym2+0x<offset from rva>.
NOTE: Currently, in REVEN v2, it is not possible to define custom symbols in a scenario.
Axion Views
Trace view
The Trace view represents the flow of system state transitions in the
recorded scenario under analysis.
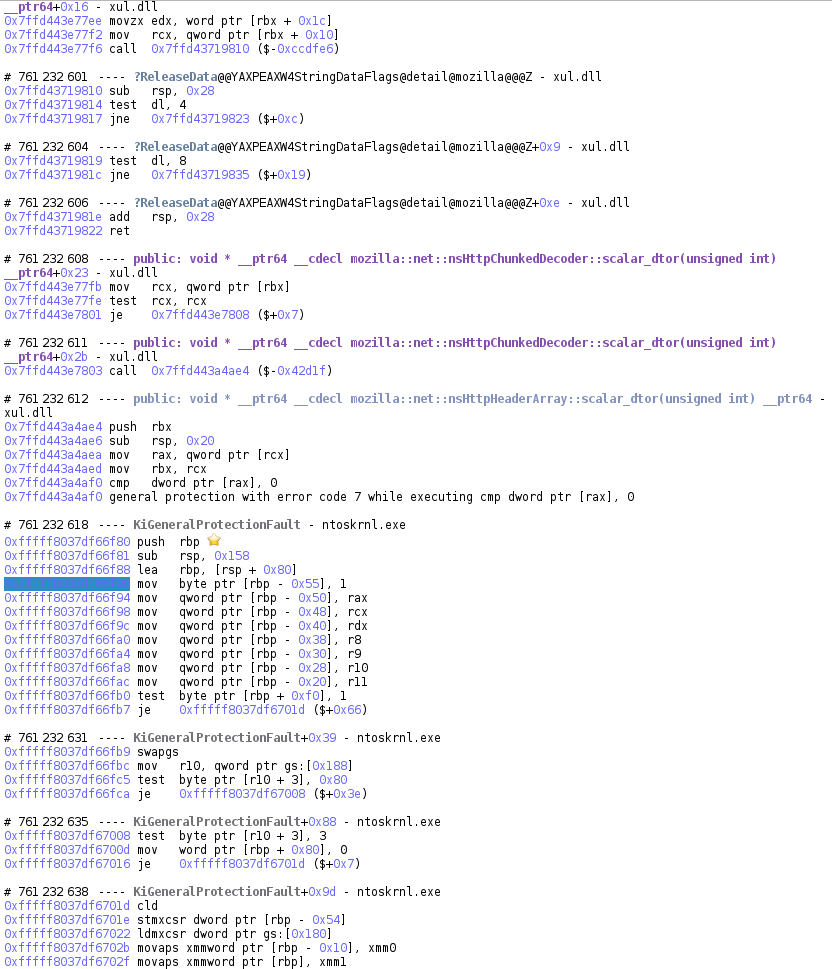
Most of the time, a transition is simply an executed instruction. However, sometimes a transition can be:
- A partially executed instruction (normal execution of the instruction was interrupted by a fault).
- An interrupt.
- A fault or an exception.
Transitions are numbered from 0, the first transition in the trace, to T, the last transition in the trace.
The trace is divided into basic blocks. Basic blocks contain transitions
occurring on contiguous code addresses. In the Trace view, each basic block
is identified by the number of its first transition, the name of the
symbol in which the transition occurs and the offset within that symbol.
NOTE: symbol information is only displayed if the OSSI information sources have been previously configured for the scenario's VM and files.
Tips
- You can select any item in the trace, such as an instruction or a register for example. All similar items will be displayed with a yellow background.
- You can select any operand in the trace and, if appropriate, open a
corresponding
Hexdumpview.
Search view
The Search view allows to search some points of interest in the Trace
view. Points of interests can be:
- Any transition.
- A transition with a given code address executed.
- A transition with a given binary executed.
- A transition with a given symbol executed.
- A transition with a call to a given symbol.
The Search view is composed of:
- A filter form to select points of interest to search.
- A timeline representing the whole set of transitions in the scenario and displaying where results are found in the trace.
- An exhaustive list of results.

Using the timeline
Going to some place in the trace
The Timeline allows to go directly to some place in the trace just by
clicking on it. A red point represents the current location in the Trace view.
Searching a sub-range of the trace
On large traces, a sub-range can be selected in the Timeline to reduce the
scope of a search:
- Right-click + drag and drop in the timeline: a green line represents the currently defined sub-range.
Comparing contexts between two transitions
CPU contexts can be compared between any two transitions in the trace:
- Left-click + drag and drop in the timeline: a red line represents the currently defined sub-range in which the CPU contexts will be compared.
Going to a bookmark
The Timeline also displays bookmarks set in the Trace. Click on the
bookmark icon in the timeline to get to the bookmark in the trace.
Searching and browsing some points of interest
- Fill the search form with your search parameters.
- Click the Search button and wait for the results to appear in the timeline and in the result dropbox.
Framebuffer view
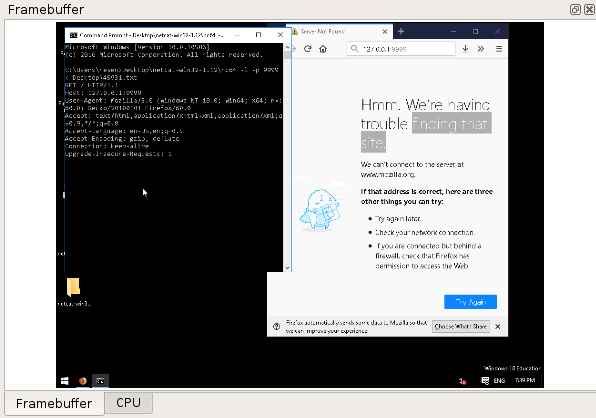
The Framebuffer view provides a view of the machine's screen state for a
given transition selected in the Trace view.
NOTE: the Metadata replay must have been run for the Framebuffer view to be available.
Backtrace view
The Backtrace view provides a list of nested calls for the currently
selected transaction in the Trace view, akin to what would be
expected in a debugger. This backtrace is dependent on the stack currently
in use, and as such is local to the current process and thread.
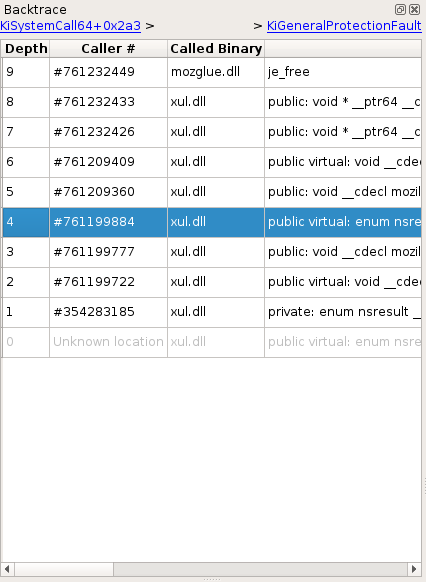
On the upper part of the widget are two links which, when possible, provide a quick way to navigate between stack switches (i.e. when the stack pointer points to a different stack) - these moments can be process switches, ring changes, process creations, etc. The left link points to the previous stack switch, and the right link to the next stack switch.
Below these links is a list of calls, sorted from latest to earliest. You can double click an entry to get to that call.
NOTE This view represents an attempt at rebuilding this information from the trace's content, and sometimes cannot be comprehensive. In that case, information from earliest calls may be missing or partial. Therefore double clicking certain entries is not possible.
NOTE: the Stack Events replay must have been run for the Backtrace view
to be available.
CPU view
The CPU view displays the state of CPU registers:
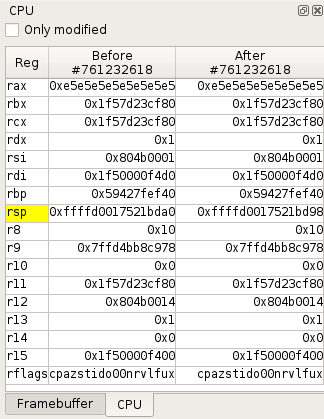
- By default, when a transition is selected in the
Traceview, it shows the CPU registers values before and after the transition. - From the
Timeline, you can also compare the CPU contexts between any two transitions in the trace.
Registers whose value has been modified by a transition or between two transitions are displayed with a yellow background. A checkbox allows you to display only modified registers.
The contextual menu provides the following actions:
- Select memory/register can be used to:
- Browse the register changes with the
Traceview Prev and Next buttons. - Open a new
Hexdumpview at the selected address.
- Browse the register changes with the
- Open an new
Hexdumpview. - Configure which registers must be displayed.
Hexdump view
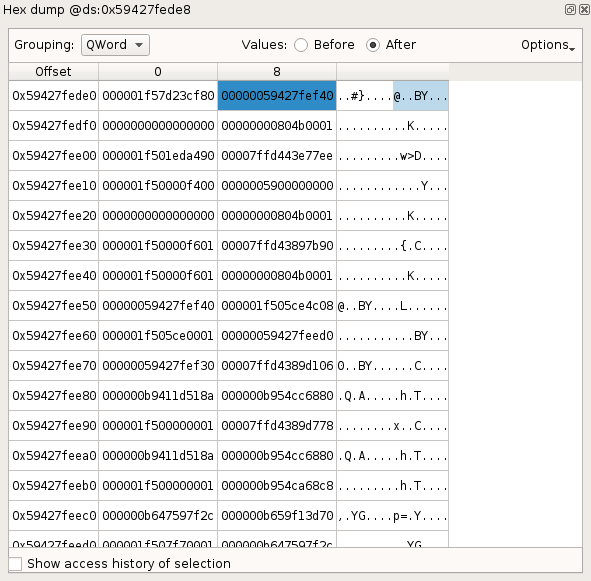
The Hexdump view shows the content of the memory starting at a given address,
before or after a given transition in the trace.
Several Hexdump views can be opened at the same time for different memory
locations.
If a memory location is not mapped at the selected execution point, ? characters will be displayed instead of its content.
Memory history
The Memory History view displays the history of the accesses to the selected memory buffer.
NOTE: the Memory History replay must have been run for the Memory History data to be available.
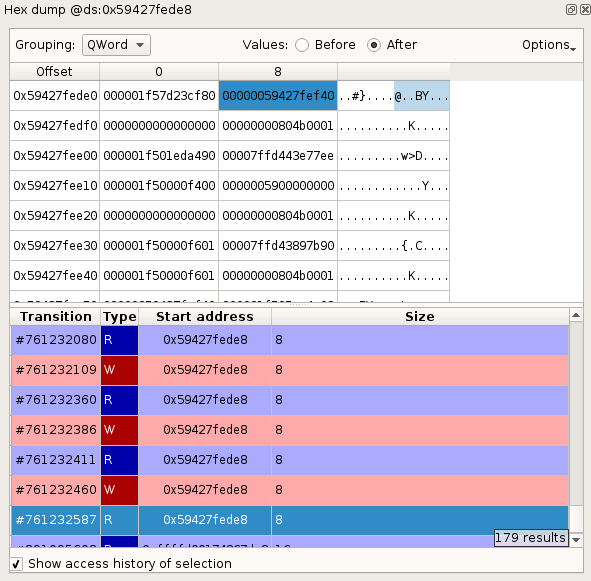
To display the history of a memory buffer:
- In a
Hexdumpview, select a Byte, DWord, QWord or any continuous range of memory. - Check Show access history of selection.
The list of Read and Write accesses to the buffer in the trace will then be displayed, centered on neighboring accesses. Each access is described with:
- A transition number in the trace.
- The access type R for read, W for write.
- The start address of the accessed memory.
- The size of the memory accessed.
To go to the transition in the trace corresponding to a given memory access, double-click its entry in the list.
Note this history reflects the activity of the physical region that the selected virtual area points to. This means that it can contain accesses to this area made through other virtual addresses if for example this area is:
- Shared with another process.
- Mapped elsewhere in the same process.
- Accessed via a physical address directly (by peripherals for instance).
- Reused later on in a different context.
Advanced details
There are a few specific details that are good to know, as they could otherwise be confusing:
- The history may not track internal accesses, such as those performed by the MMU itself while resolving accesses.
- The history does not track failed access attempts leading to page faults - unless if said access spans over more than one page and the first page is mapped but the rest is not, in which case there will be an entry for the first part of this access.
- What would intuitively be expected as a single access may appear sliced into consecutive smaller ones in various cases (access is more than 8 byte large, access spans over more than one page, etc.). This is tracer dependent.
- Certain instructions might generate counter-intuitive accesses: for instance,
BTS(bit test and set) may access a whole 8-byte region. Again, this is tracer dependent.
Strings view
The Strings view allows to display and filter all accessed memory buffers
in the trace that look like valid strings.
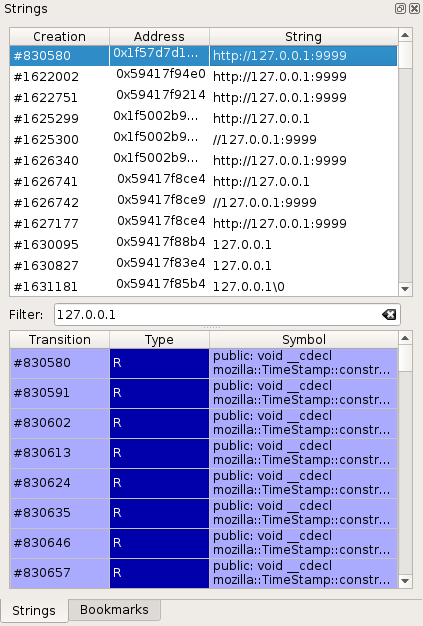
Each accessed buffer is described with:
- A transition number in the trace.
- The memory address of the buffer.
- The string value.
To view the access history of a buffer:
- Select the buffer in the list by clicking on it + Enter or double-clicking on it.
Each entry in the access history shows:
- A transition number in the trace. Double-click on the entry to get
to the transition in the
Traceview. - The access type R for read, W for write.
- The Symbol that performed the access, if known.
NOTE: the Strings replay must have been run for the Strings data to be available.
Taint view
The taint view allows to follow the data flow in the trace, either forward or backward.
The taint analysis automates the task of following some data from memory buffers and registers to other buffers. When performing a backward taint, it allows to find the origin of the tainted data.
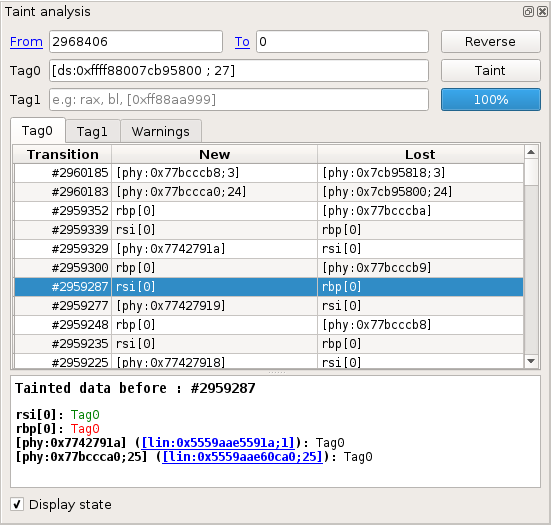
Specifying taint parameters
On the upper part of the widget are some input controls that allow to specify the taint parameters:
Fromindicates the first transition to taint.Toindicates the first transition not in the taint.Tag0andTag1indicate which data should be marked. Different data can be marked inTag0andTag1, in order to follow their propagation in parallel. For more information on what data can be tainted, please refer to the Taint data format section.
To perform a backward taint, the transition number in the To control should
be lower than in the From control (e.g., From = 2968405, To = 0).
Otherwise, the taint will be forward.
The Reverse button allows to swap the content of From and To, switching
between a forward and a backward taint.
Browsing taint results
On the middle part of the widget are several tabs. The Tag0 and Tag1 tabs
each contain a table indicating all changes to tainted data that occurred during
the taint. The Tag0 tab indicates changes that involve data marked with
Tag0, and similarly for Tag1.
For each taint change in the list, the following information is provided:
Transition: the transition number of the change.New: shows data newly tainted.Lost: shows data that just lost taint. You can double click any entry in that list to display the transition where the change occurred in theTraceview.
NOTE: If you encounter any problem with the taint, you can check the
Warnings tab to see some information about what happened during the taint
process. The warnings are also displayed as a clickable Warning icon next to
the affected change in the change view. It is recommended to manually check
changes when there is a warning icon displayed next to them.
The bottom part of the widget can be activated by checking the Display state
checkbox. It presents the current state of all tainted data (regardless of
Tag0 and Tag1) at the transition that is currently selected in the trace.
NOTE: Although, internally, the taint works using physical addresses, the taint attempts to rebuild linear addresses in the taint state view. These linear addresses are clickable links that will open a new hexdump.
Taint data format
Various kinds of data can be tainted, here is a list:
- A register:
rax,rbx,eax,ah - A slice of register:
rax[0:3](is the same aseax),rax[2] - A byte of logical memory (implicit ds segment):
[0x4242]taintsds:0x4242 - A range of logical memory (implicit ds segment):
[0x4242; 2]taintsds:0x4242andds:0x4243 - A byte of logical memory (segment register):
[gs:0x4242]taintsgs:0x4242 - A range of logical memory (segment register):
[gs:0x4242; 2]taintsgs:0x4242andgs:0x4243 - A byte of logical memory (numeric segment index):
[0x23:0x4242]taints0x23:0x4242 - A range of logical memory (numeric segment index):
[0x23:0x4242; 2]taints0x23:0x4242and0x23:0x4243 - A byte of linear memory:
[lin:0x4242]taints linear address0x4242 - A range of linear memory:
[lin:0x4242; 2]taints linear addresses0x4242and0x4243 - A byte of physical memory:
[phy:0x4242]taints0x4242 - A range of physical memory:
[phy:0x4242; 2]taints0x4242and0x4243
NOTE: Several pieces of data can be tainted at once for each tag.
Example: Tag0: [0x2523808; 24], rax[4], rsp, [phy:0x1234f] will tag
ds:0x2523808 through ds:252381f, the fourth byte of rax, the entirety of
rsp and the physical byte at address 0x1234f.
Known limitations
- The taint may fail to propagate the taint on some instructions
(notably,
swapgs). The corresponding warning message isunable to lift instruction. - The taint may fail to propagate correctly on FPU instructions. The
corresponding warning message is
X87 FPU access in forward taint analysis. - The taint uses information obtained at the basic-block level to infer local
simplifications (for instance, it can infer that in the instruction sequence
{mov rax, rbx; xor rax, rbx}, thexoralways resetsraxto 0.). This inference may result in surprising displays in the table views, in backward (some register may lose the taint at one instruction, and some memory may "regain" the taint, apparently from nowhere). This is simply a display limitation and does not otherwise affect the correctness of the taint. - Tainting large ranges of memory (several MB) may result in a very slow taint that uses a lot of CPU.
- Only a single taint can run concurrently per REVEN server: currently, starting a second taint, even from a different Axion, will cancel the first running taint. Besides, if two Axion sessions are involved, the first Axion session may display mixed taint results.
Bookmarks view
The Bookmarks view lists bookmarks that you can create on any transition in
the trace, together with a name and a comment.
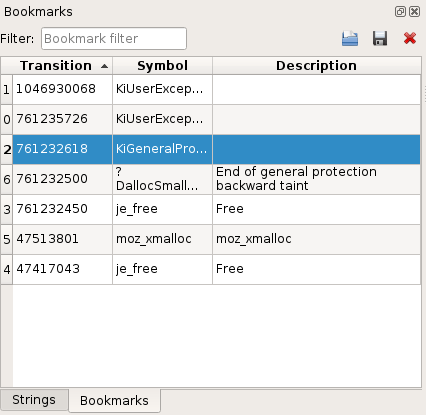
To create a bookmark:
- Select a transition in the
Trace view. - Click right to get to the contextual menu and select Add bookmark (or use the corresponding keyboard shortcut).
Logs view
The Logs view displays information, warning, error messages encountered by the Axion GUI.
It is a good idea to check this view when something unexpected occurs in the GUI.
Axion % Plugin
The percent plugin adds the capability of jumping between stack memory
accesses. If the currently selected instruction writes something on the stack,
percent will go to the next instruction reading the memory. Conversely, if the
current instruction is reading some value on the stack, percent will jump to
the previous instruction writing the memory. In practice, this is very useful
to follow push/pop operands or call/ret boundaries.
The plugin is named percent as it has been designed to work like the vim editor
percent keybinding on curly brackets.
The default key binding for this plugin is %. If you wish to modify this
binding, use the shortcut configuration panel in Axion
Axion IDA Sync Plugin
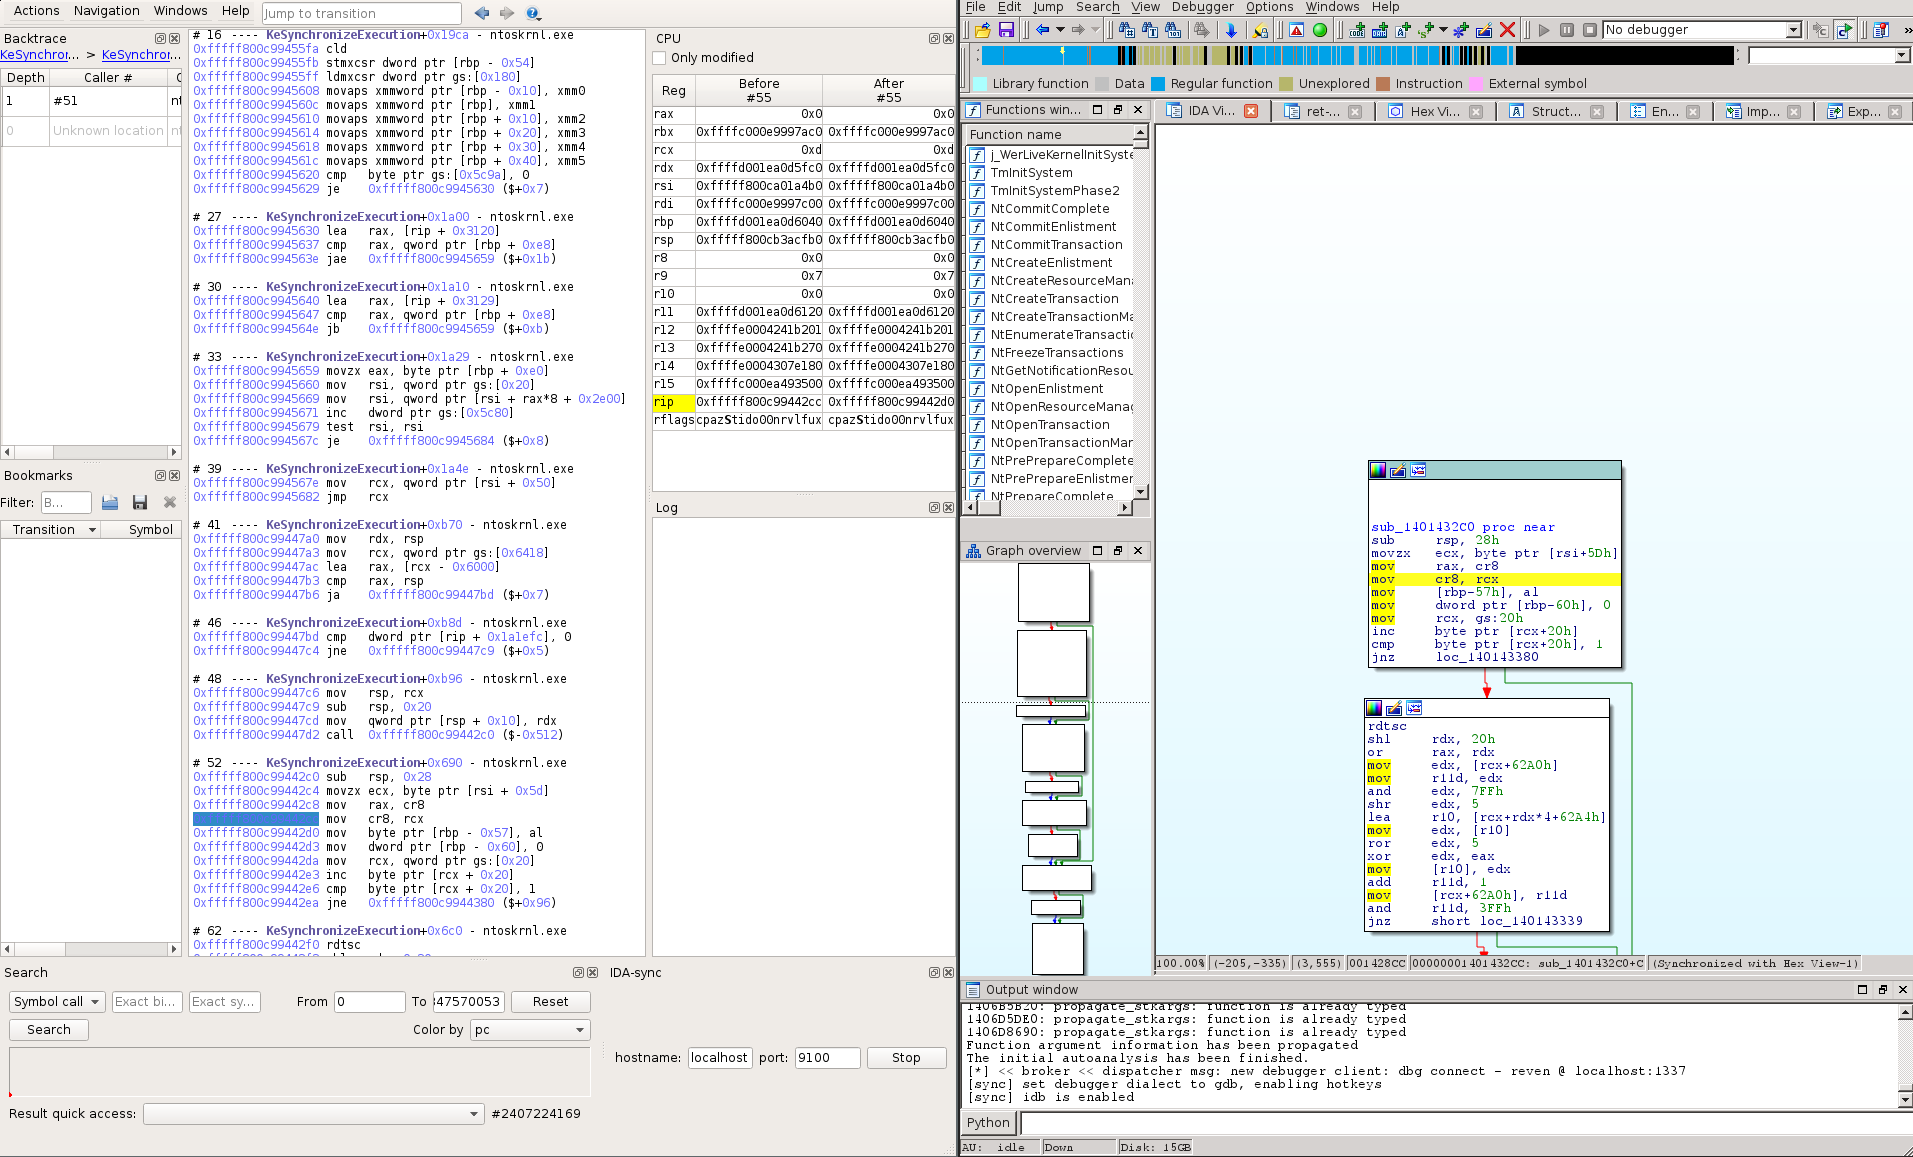
The IDA-sync Axion plugin enables the synchronization of IDA instances with the
currently selected instruction of an Axion instance. It is basically a wrapper
around Ret-Sync, which is a tool written by Alexandre Gazet.
Setting up the plugin
Prerequisites
There are several prerequisites in order to use the plug-in:
- OSSI for your scenario must be available in REVEN.
- You must ensure network connectivity between the Axion and IDA hosts. In particular, if a firewall is activated, it must allow to open a socket on the selected host and port.
Installing Ret-Sync
To use the plugin, you have to download Ret-Sync first. We recommend fetching our forked project on Github as it is the REVEN-supported version.
$ git clone https://github.com/tetrane/ret-sync
Configuring Ret-Sync
Ret-Sync allows remote setup, that is having IDA on a different host than Axion. To allow this kind of configuration, the Ret-Sync IDA plugin handles debugger events through a network socket and dispatches them to the right IDA window. More information can be found our Github repository.
The figure below describes how Ret-Sync is deployed between Axion and IDA.
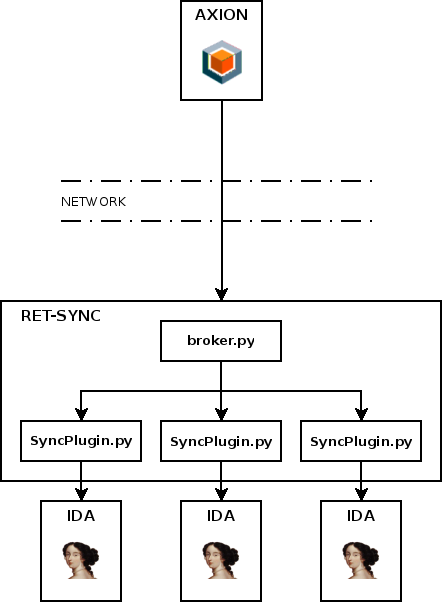
By default, Ret-Sync will work on a local configuration where IDA and Axion are on the same host (Ret-Sync will listen on 127.0.0.1). If it is your case you can skip this part.
To allow remote usage of Ret-Sync, a configuration file must be placed on the
IDA host. The configuration file should be named exactly .sync and can be
located either in the IDB or in the Home directories. The .sync file follows
the .ini syntax and allows setting the host and port the Ret-Sync will listen
on. eg:
[INTERFACE]
host=192.168.1.16
port=9100
The host option is the IDA host machine address, which can be retrieved by
issuing an ipconfig command on Windows or ifconfig / ip addr on Linux.
Using the plugin
Loading target binary in IDA
To synchronize an IDA instance with Axion, you obviously need to load a binary used in the scenario. If you do not already have this binary, you can extract it from the scenario archive on the Project Manager server, in:
QUASAR_ROOT/VMs/<your_vm>/Snapshots/<your_prepared_snapshot>/filesystem/
Loading Ret-Sync IDA plugin
We assume that you downloaded Ret-Sync from Tetrane's github forked project.
There are three IDA plugins in the Ret-Sync repository:
ext_ida/SyncPlugin-6.8-or-lower.py: must be used with IDA 6.8 or lower version.ext_ida/SyncPlugin-6.9x.py: must be used with IDA 6.9.ext_ida/SyncPlugin-7-or-higher.py: must be used with IDA 7 or higher version.
You can then load the Ret-Sync IDA plugin that matches your IDA version through
the File > Script File menu. This will create a Ret-Sync process listening for
debugger events.
Once loaded, the plugin will create a new tab in IDA and allow you to change the binary name. IDA-Sync enables the synchronization only when the correct binary is being debugged so you must ensure that the IDA and REVEN binary names are perfectly matching.
Connecting Axion to IDA
Finally, you can start the Axion IDA-sync plugin from the Axion menu
Windows > Miscellaneous and connect to the previously loaded IDA
plugin (using the machine address and port of the IDA host) to enable the
synchronisation.
NOTE: If the base address of the studied binary is different between Axion
and IDA (because of ASLR for example), the synchronisation will still work
correctly but the displayed addresses will be different between Axion and IDA.
To have the same addresses, the binary in IDA must be rebased to the right base
address (using the Edit > Segments > Rebase Program menu) and the plugins in
IDA and Axion must be restarded.
REVEN v2 Python API quick start
With the REVEN v2 Python API, reverse engineers can automate the analysis of a scenario using script.
About this document
This document is a quick start guide to the REVEN v2 Python API. The REVEN v2 Python API can be used to automate several aspects of REVEN:
- The recording/replay workflow (Workflow Python API)
- The analysis of an already replayed scenario (Analysis Python API)
This document focuses solely on the Analysis Python API. It covers the following topics:
- Installation
- Basic usage
- Main concepts
- Overview of the available features
Along the way, this document provides some simple recipes you can use to automate various tasks.
Installation
Please refer to the Installation page for more information on installing the Python API.
Basic usage
Once you've installed the Python API (see the Installation document), you're ready for your first script.
Import the reven2 package:
>>> # Importing the API package
>>> import reven2
Connecting to a server
To use the Python API, you have to connect to a REVEN server started on the scenario you want to analyze. To do this, you must provide the host and port of your REVEN server:
>>> # Connecting to a reven server
>>> hostname = "localhost"
>>> port = 13370
>>> server = reven2.RevenServer(hostname, port)
>>> server
Reven server (localhost:13370) [connected]
If you are using the Python API from the same machine than the REVEN server itself, then the host is "localhost",
otherwise it is the address of your server.
To find the port, you can go to the Analyze page for the scenario you want to connect with, and the port number will be
displayed in the label above the buttons (REVEN running on port xxxx):
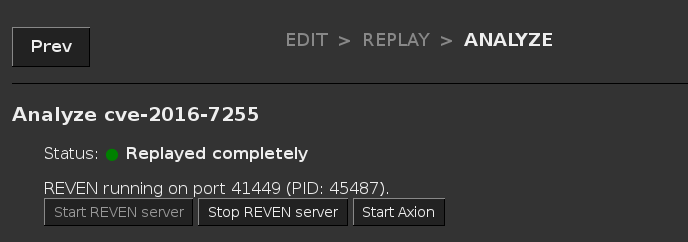
Alternatively, you can find the port in the Active sessions list:

Finally, if you have an Axion client connected to your REVEN server, you can find the port in the titlebar of the Axion window:

Root object of the API, tree of objects
The RevenServer instance serves as the root object of the API from where you can access all the features of the API.
The following diagram gives a high-level view of the Python API:
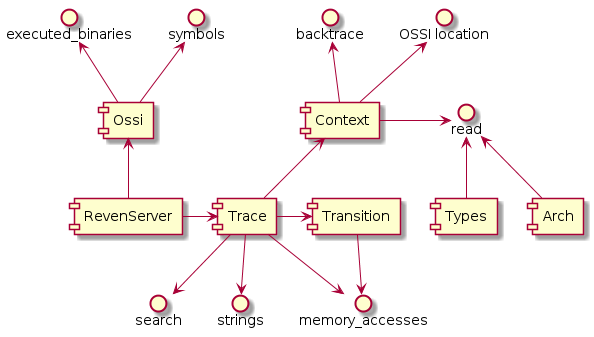
For instance, from there you can get the execution trace and ask for the total number of transitions in the trace:
>>> # Getting the trace object
>>> trace = server.trace
>>> # Getting the number of transitions in the trace
>>> trace.transition_count
2847570054
In your python interactive shell, you can also use the help built-in function to directly access the documentation while coding (see the official python documentation for more details on this function).
We recommend using a feature-rich shell like ipython or bpython to benefit from e.g. auto-completion while using the Python API.
Main concepts
Getting a point in time
As is visible in Axion, all instructions are identified by a single unique integer, called the transition id. The transition id starts at 0 for the first instruction in the trace, and is incremented by 1 for each consecutive instruction.
Note: We are using the term Transition rather than Instruction here, because technically, not all Transitions in
the trace are Instructions: when an interrupt or a fault occurs, it is also denoted by a Transition that changed the
Context, although no Instruction was executed. Similarly, instructions that execute only partially (due to being
interrupted by e.g. a pagefault) are not considered as normal Instructions. You can see a Transition as a
generalized Instruction, i.e. something that modifies the context.
Getting a transition
You can get interesting transition numbers from Axion's instruction view.

>>> # Getting a transition
>>> transition = trace.transition(1234)
>>> # Displays the transition as seen in Axion
>>> print(transition)
#1234 jne 0xfffff800c9821dc7 ($+0xac)
>>> # Is this transition an instruction?
>>> transition.instruction is not None
True
Getting a context
A Transition is representing a change in the trace, while Contexts represent a state in the trace.
From a transition, you can get either the context before the transition was applied, or the context after the transition was applied:
>>> # Comparing rip before and after executing an instruction
>>> ctx_before = transition.context_before()
>>> ctx_after = transition.context_after()
>>> "0x{:x}".format(ctx_before.read(reven2.arch.x64.rip))
'0xfffff800c9821d1b'
>>> "0x{:x}".format(ctx_after.read(reven2.arch.x64.rip))
'0xfffff800c9821d21'

>>> # Directly getting a context from the trace object
>>> trace.context_before(0x1234) == trace.transition(0x1234).context_before()
True

>>> # Getting a transition back from a context
>>> transition.context_before().transition_after() == transition
True
Reading a context
A common operation on a Context instance is to read the state of the CPU registers as well as memory.
The API provides the read method on Context, that allows to read from a source.
Getting a register or an address
To read from a register source, you can reference elements exposed by the arch package:
>>> import reven2.arch.x64 as regs
>>> ctx = transition.context_before()
>>> ctx.read(regs.rax)
35680
>>> ctx.read(regs.al)
96
>>> # Are we in kernel land?
>>> ctx.read(regs.cs) & 3 == 0
True
To read from a source address, use the address module to construct addresses:
>>> # Comparing the bytes at RIP in memory with the bytes of the instruction
>>> from reven2.address import LogicalAddress, LinearAddress, PhysicalAddress
>>> rip = ctx.read(regs.rip)
>>> instruction = transition.instruction
>>> ctx.read(LogicalAddress(rip, regs.cs), instruction.size) == instruction.raw
True
Reading as a type
The types package of the API provides classes and instance dedicated to the representation of data types.
They allow to read a register or some memory as a specific data type.
>>> from reven2 import types
>>> # Reading rax as various integer types
>>> ctx.read(regs.rax, types.U8)
96
>>> ctx.read(regs.rax, types.U16)
35680
>>> ctx.read(regs.rax, types.I16)
-29856
>>> # Reading in a different endianness (default is little endian)
>>> ctx.read(regs.rax, types.BigEndian(types.U16))
24715
>>> # Reading some memory as a String
>>> ctx.read(LogicalAddress(0xffffe00041cac2ea), types.CString(encoding=types.Encoding.Utf16, max_character_count=1000))
u'Network Store Interface Service'
>>> # Reading the same memory as a small array of bytes
>>> ctx.read(LogicalAddress(0xffffe00041cac2ea), types.Array(types.U8, 4))
[78, 0, 101, 0]
>>> # Dereferencing rsp + 0x20 in two steps
>>> addr = LogicalAddress(0x20) + ctx.read(regs.rsp, types.USize)
>>> ctx.read(addr, types.U64)
10738
>>> # Dereferencing rsp + 0x20 in one step
>>> ctx.deref(regs.rsp, types.Pointer(types.U64, base_address=LogicalAddress(0x20)))
10738
Identifying points of interest
One of the first tasks you need to perform during an analysis is finding an interesting point from where to start the analysis. The API provides some tools designed to identify these points of interests.
Getting and using symbol information
A typical starting point for an analysis is to search points where a specific symbol is executed. In the API, this is done in two steps:
- Identify the symbol in the available symbols of the trace.
- Search for the identified symbol.
For the first step, you need to recover the OS Semantics Information (OSSI) instance tied to your RevenServer instance:
>>> # Recovering the OSSI object
>>> ossi = server.ossi
Note that for the OSSI feature to work in the API, the necessary OSSI resources must have been generated. Failure to do so may result in several of the called methods to fail with an exception. Please refer to the documentation of each method for more information.
From there you can use the methods of the Ossi instance to get the binaries that were executed in the trace, and all
the symbols of these binaries.
Note that each of these methods, like all methods returning several results of the API, return python generator objects.
>>> # Getting the first binary named "ntoskrnl.exe" in the list of executed binaries in the trace
>>> ntoskrnl = ossi.executed_binaries("ntoskrnl.exe").next()
>>> ntoskrnl
Binary(path='c:/windows/system32/ntoskrnl.exe')
>>> # Getting the list of the symbols in "ntoskrnl.exe" containing "NtCreateFile"
>>> nt_create_files = list(ntoskrnl.symbols("NtCreateFile"))
>>> nt_create_files
[Symbol(binary='ntoskrnl', name='NtCreateFile', rva=0x4123b0), Symbol(binary='ntoskrnl', name='VerifierNtCreateFile', rva=0x6cf7bc)]
Once you have a symbol or a binary, you can use the search feature to look for contexts whose rip location
matches the symbol or binary.
>>> # Getting the first context inside of the first call to `NtCreateFile` in the trace
>>> create_file_ctx = trace.search.symbol(nt_create_files[0]).next()
>>> create_file_ctx
Context(id=14771105)
>>> # Getting the first context executing the `whoami.exe` binary
>>> whoami = ossi.executed_binaries("whoami.exe").next()
>>> whoami_ctx = trace.search.binary(whoami).next()
>>> whoami_ctx
Context(id=2616590520)
For any context, you can request the current OSSI location:
>>> # Checking that the current symbol is NtCreateFile
>>> create_file_ctx.ossi.location()
Location(binary='ntoskrnl', symbol='NtCreateFile', address=0xfffff800c9c133b0, base_address=0xfffff800c9801000, rva=0x4123b0)
>>> # When the symbol is unknown it is not displayed and set to None
>>> whoami_ctx.ossi.location()
Location(binary='whoami', address=0x7ff72169c730, base_address=0x7ff721690000, rva=0xc730)
>>> whoami_ctx.ossi.location().symbol is None
True
You can also request the location corresponding to a different (currently mapped) cs virtual address:
>>> # Requesting the 'NtCreateFile' symbol location from a context at a different location
>>> ctx.ossi.location()
Location(binary='ntoskrnl', symbol='PoExecutePerfCheck', address=0xfffff800c9821d1b, base_address=0xfffff800c9801000, rva=0x20d1b)
>>> ctx.ossi.location(0xfffff800c9c133b0)
Location(binary='ntoskrnl', symbol='NtCreateFile', address=0xfffff800c9c133b0, base_address=0xfffff800c9801000, rva=0x4123b0)
>>> # Moving a bit changes the rva
>>> hex(ctx.ossi.location(0xfffff800c9c133df).rva)
'0x4123df'
Searching executed addresses in the trace
If you don't have a symbol attached to your address, you can also search for a specific address using the search function:
>>> # Searching for an executed address we saw in `whoami.exe`
>>> whoami_ctx == trace.search.pc(0x7ff72169c730).next()
True
Searching for strings in the trace
You can use the strings feature to search points in the trace where strings are first accessed or created:
>>> # Looking for a string containing "Network"
>>> string = trace.strings("Network").next()
>>> string
String(data='Network Store Interface Service\\0', size=64, address=LinearAddress(offset=0xffffe00041cac2ea), first_access=#40814 movdqu xmm0, xmmword ptr [rdx + rcx], last_access=Transition(id=40828), encoding=<Encoding.Utf16: 1>)
>>> # Getting the list of memory accesses for the string
>>> for access in string.memory_accesses():
...     print(access)
...
[#40814 movdqu xmm0, xmmword ptr [rdx + rcx]]Read access at @phy:0x7cffb2e8 (virtual address: lin:0xffffe00041cac2e8) of size 8
[#40815 movdqu xmm1, xmmword ptr [rdx + rcx + 0x10]]Read access at @phy:0x7cffb2f0 (virtual address: lin:0xffffe00041cac2f0) of size 16
[#40821 movdqu xmm0, xmmword ptr [rdx + rcx]]Read access at @phy:0x7cffb300 (virtual address: lin:0xffffe00041cac300) of size 16
[#40822 movdqu xmm1, xmmword ptr [rdx + rcx + 0x10]]Read access at @phy:0x7cffb310 (virtual address: lin:0xffffe00041cac310) of size 16
[#40828 movdqu xmm0, xmmword ptr [rdx + rcx]]Read access at @phy:0x7cffb320 (virtual address: lin:0xffffe00041cac320) of size 16
Manually iterating in the trace
Another way of searching interesting points is by iterating over contexts or transitions, and then looking for various information by inspecting the context or transition. Beware that if you iterate on a large portion of the trace, it may take a very long time to complete, so prefer the predefined search APIs that use optimized indexes whenever it is possible.
>>> # Finding first instruction whose mnemonic is swapgs
>>> # Warning: this example may take some time to execute
>>> import builtins  # for python 2/3 cross compatibility
>>> def find_mnemonic(trace, mnemonic, from_transition=None, to_transition=None):
...     for i in builtins.range(from_transition.id if from_transition is not None else 0,
...                             to_transition.id if to_transition is not None else trace.transition_count):
...         t = trace.transition(i)
...         if t.instruction is not None and mnemonic in t.instruction.mnemonic:
...             yield t
...
>>> find_mnemonic(trace, "swapgs").next()
Transition(id=184230)
Combining the predefined search APIs with manual iteration allows to iterate over a smaller portion of the trace to extract useful information:
>>> # Finding all files that are created in a call to NtCreateFile
>>> def read_filename(ctx):
...    # filename is stored in a UNICODE_STRING structure,
...    # which is stored inside of an object_attribute structure,
...    # a pointer to which is stored as third argument (r8) to the call
...    object_attribute_addr = ctx.read(regs.r8, types.USize)
...    # the pointer to the unicode string is stored as third member at offset 0x10 of object_attribute
...    punicode_addr = object_attribute_addr + 0x10
...    unicode_addr = ctx.read(LogicalAddress(punicode_addr), types.USize)
...    # the length is stored as first member of UNICODE_STRING, at offset 0x0
...    unicode_length = ctx.read(LogicalAddress(unicode_addr) + 0, types.U16)
...    # the buffer is stored as third member of UNICODE_STRING, at offset 0x8
...    buffer_addr = ctx.read(LogicalAddress(unicode_addr) + 8, types.USize)
...    filename = ctx.read(LogicalAddress(buffer_addr),
...                           types.CString(encoding=types.Encoding.Utf16, max_size=unicode_length))
...    return filename
...
>>> for (index, ctx) in enumerate(trace.search.symbol(nt_create_files[0])):
...     if index > 5:
...         break
...     print("{}: {}".format(ctx, read_filename(ctx)))
...
Context before #14771105: \??\C:\Windows\SystemApps\ShellExperienceHost_cw5n1h2txyewy\resources.pri
Context before #14816618: \??\PhysicalDrive0
Context before #16353064: \??\C:\Users\reven\AppData\Local\...\AC\Microsoft
Context before #16446049: \??\C:\Users\reven\AppData\Local\...\AC\Microsoft\Windows
Context before #16698900: \??\C:\Windows\rescache\_merged\2428212390\2218571205.pri
Context before #26715236: \??\C:\Windows\system32\dps.dll
Moving in the trace
Once you identified point(s) of interest, the next step in the analysis is to navigate by following data from these points.
The API provides several features that can be used to do so.
Using the memory history
The main way to use the memory history in the trace is to use the Trace.memory_accesses method.
This method allows to look for the next access to some memory range, starting from a transition and in a given
direction:
>>> # Choosing a memory range to track
>>> address = LogicalAddress(0xffffe00041cac2ea)
>>> # Getting the next access to that memory range from the current point
>>> memhist_transition = trace.transition(40818)
>>> trace.memory_accesses(address, size=64, from_transition=memhist_transition).next()
MemoryAccess(transition=Transition(id=40821), physical_address=PhysicalAddress(offset=0x7cffb300), size=8, operation=MemoryAccessOperation.Read, virtual_address=LinearAddress(offset=0xffffe00041cac300))
>>> # Getting the previous access to that memory range from the current point
>>> trace.memory_accesses(address, size=64, from_transition=memhist_transition, is_forward=False).next()
MemoryAccess(transition=Transition(id=40815), physical_address=PhysicalAddress(offset=0x7cffb2f8), size=8, operation=MemoryAccessOperation.Read, virtual_address=LinearAddress(offset=0xffffe00041cac2f8))
>>> # Getting all accesses to that memory range in the trace
>>> for access in trace.memory_accesses(address, size=64):
...     print(access)
...
[#40814 movdqu xmm0, xmmword ptr [rdx + rcx]]Read access at @phy:0x7cffb2e8 (virtual address: lin:0xffffe00041cac2e8) of size 8
[#40815 movdqu xmm1, xmmword ptr [rdx + rcx + 0x10]]Read access at @phy:0x7cffb2f0 (virtual address: lin:0xffffe00041cac2f0) of size 8
[#40815 movdqu xmm1, xmmword ptr [rdx + rcx + 0x10]]Read access at @phy:0x7cffb2f8 (virtual address: lin:0xffffe00041cac2f8) of size 8
[#40821 movdqu xmm0, xmmword ptr [rdx + rcx]]Read access at @phy:0x7cffb300 (virtual address: lin:0xffffe00041cac300) of size 8
[#40821 movdqu xmm0, xmmword ptr [rdx + rcx]]Read access at @phy:0x7cffb308 (virtual address: lin:0xffffe00041cac308) of size 8
[#40822 movdqu xmm1, xmmword ptr [rdx + rcx + 0x10]]Read access at @phy:0x7cffb310 (virtual address: lin:0xffffe00041cac310) of size 8
[#40822 movdqu xmm1, xmmword ptr [rdx + rcx + 0x10]]Read access at @phy:0x7cffb318 (virtual address: lin:0xffffe00041cac318) of size 8
[#40828 movdqu xmm0, xmmword ptr [rdx + rcx]]Read access at @phy:0x7cffb320 (virtual address: lin:0xffffe00041cac320) of size 8
[#40828 movdqu xmm0, xmmword ptr [rdx + rcx]]Read access at @phy:0x7cffb328 (virtual address: lin:0xffffe00041cac328) of size 8
Note that the memory history works with physical addresses under the hood. Although it accepts virtual addresses in input, the range of virtual addresses in translated to physical ranges before querying the memory history. As a result, the vitual address range needs to mapped at the context of the translation for the call to succeed.
A secondary method to use is the Transition.memory_accesses method that provides all the memory accesses that occurred
at a given transition.
>>> # Getting all memory that is accessed during a "rep mov" operation
>>> rep_tr = trace.transition(49579)  # found with "find_mnemonic"
>>> print(rep_tr)
#49579 rep outsd dx, dword ptr [rsi]
>>> [(access.virtual_address, access.size) for access in rep_tr.memory_accesses()]
[(LinearAddress(offset=0xffffe000427c6fb0), 2), (LinearAddress(offset=0xffffe000427c6fb2), 2), (LinearAddress(offset=0xffffe000427c6fb4), 2), (LinearAddress(offset=0xffffe000427c6fb6), 2), (LinearAddress(offset=0xffffe000427c6fb8), 2), (LinearAddress(offset=0xffffe000427c6fba), 2)]
Using the backtrace
For any context, you can get the associated call stack by calling the Context.stack property:
>>> # Getting the call stack
>>> rep_ctx = rep_tr.context_before()
>>> stack = rep_ctx.stack
>>> stack
Stack(Context=49579)
>>> # Displaying a human-readable backtrace
>>> stack.backtrace
[0] - #49574 - ataport!AtaPortWritePortBufferUshort
[1] - #49409 - atapi+0x23b0
[2] - #49392 - ataport!AtaPortGetParentBusType+0x3ef0
[3] - #49367 - ataport+0x6164
[4] - #49347 - ataport!AtaPortInitialize+0x49e0
[5] - #49323 - ntoskrnl!KeSynchronizeExecution
[6] - #49064 - ataport!AtaPortGetParentBusType+0x3ef0
[7] - #49000 - ataport!AtaPortInitialize+0x45a0
[8] - #48910 - ataport!AtaPortInitialize+0x3370
[9] - #48662 - ataport!AtaPortInitialize+0x2fac
[10] - #48097 - wdf01000+0x368e0
[11] - #47666 - wdf01000+0x19a70
[12] - #47597 - cdrom+0x5e30
[13] - #47529 - cdrom+0x1000
[14] - #46015 - wdf01000+0x368e0
[15] - #45936 - wdf01000+0x23ff8
[16] - #45927 - wdf01000+0x24d60
[17] - #45894 - ntoskrnl!IopProcessWorkItem
[18] - ??? - ntoskrnl!ExpWorkerThread+0x80
From there, you can use the backtrace to navigate in at least two ways:
- By going back to the caller of the current frame.
>>> # Finding back the caller transition if it exists
>>> print(stack.frames().next().creation_transition)
#49574 call qword ptr [rip + 0x4af2]
- By going back to the previous stack. This allows for instance to switch from kernel land to user land, or to find/skip syscalls when necessary.
>>> stack.prev_stack().backtrace
[0] - #45719 - ntoskrnl!SwapContext
[1] - #45695 - ntoskrnl!KiSwapContext
[2] - #45487 - ntoskrnl!KiSwapThread
[3] - #45431 - ntoskrnl!KiCommitThreadWait
[4] - #45248 - ntoskrnl!KeWaitForMultipleObjects
[5] - ??? - dxgkrnl!DxgkUnreferenceDxgResource+0x2576a
Feature overview
The following table offers a simple comparison between widgets and features of Axion and Python API methods:
| Widget | API |
|---|---|
| CPU | Context.read |
| Instruction view | Transition, Context.ossi.location |
| Hex dump | Context.read |
| Memory History | Trace.memory_accesses, Transition.memory_accesses |
| Search | Trace.search |
| Backtrace | Context.stack |
| String | Trace.strings |
| Taint | Available in preview: preview.taint |
Going further
This concludes the Python API quick start guide. For further information on the Python API, please refer to the following documents:
-
Python API analysis examples that are distributed in the
Downloadspage of the REVEN Project Manager. These scripts demonstrate the possibilities offered by the Python API through more elaborate examples. -
IDA Python API examples that are distributed in the
Downloadspage of the REVEN Project Manager. These scripts showcase the IDA compatibility of the Python API, that is, the simple capability of using the Python API from IDA:>>> import reven2 # This works from IDA, too -
The full Python API reference documentation
REVEN v2 - Cookbooks
REVEN v2 - Auto-record on QEMU
The auto-record feature in the Project Manager Python API allows you to perform a record without having you starting and stopping the record manually, detecting automatically when the record should start/stop instead. Also, when using the autorun feature, you will be able to completly bypass any manual interaction with the guest to perform the record.
Note that the auto-record functionality is currently in preview and exclusive to QEMU. As a result, it may contain bugs, and the interface is subject to change in a later version. In particular, the API we currently offer requires manipulating fairly low-level concepts.
This documents aims at explaining how to use the auto-record API. To do so, it covers the following topics:
- The general concepts of automatic recording required to use the API
- How to use autorun to allow a fully automated recording
- How to use the two auto-record types available in the API:
- Recording a single binary
- Recording using ASM stubs to allow precise control over when to start/stop the record from inside the guest.
You can find a complete example of using the auto-record feature in the Project Manager Python API examples named automatic-binary-record.py.
General
Concept
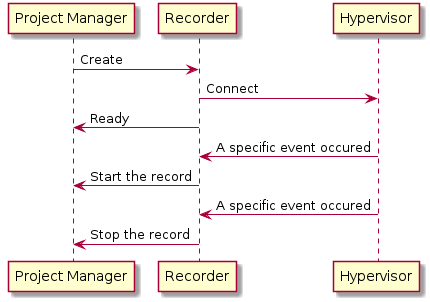
To perform auto-records, the Project Manager uses a recorder, which will communicate with the hypervisor in order to monitor the execution in the guest. So, the recorder knows what is happening on the guest, and is able to ask the Project Manager to start or stop the record after a specific event occurred. (e.g the start of a binary or a special sequence of ASM instructions executed by the guest).
The recorder requires initialization before it can enter the ready state, and this operation can take time depending of the state of the guest.
As a result, you will need to monitor the status of the recorder. You can retrieve the current status of the recorder from the field recorder_status of an auto-record task (retrieved by calling the get_task method of the Project Manager Python API)
Here is the list of possible statuses:
NOT_READY: Therecorderisn't ready and initialized yetREADY: Therecorderis ready, it will start the record as soon as the expected event occursRECORDING: The record has been startedRECORDED: The record has been stoppedFAILED: The auto-record failed for a specific reason (you can retrieve the reason in the fieldfail_reasonof a auto-record task)ABORTED: The record was aborted for a specific reason (you can retrieve the reason in the fieldfail_reasonof a auto-record task)TIMEOUT: The auto-record timed out before the start of any record (see the argumenttimeout_startin the next section)RECORD_TIMEOUT: The auto-record timed out during the record. The record was saved anyway. (see the argumenttimeout_recordin the next section)RECORD_COMMITED: The auto-record succeeded and the record was saved
You should not assume that the recorder_status will only go from the RECORDING to the RECORDED status: you will encounter cases where the status will reach RECORDED at some point, and then go back to RECORDING. This may happen for instance when recording a binary because the recorder has detected that it may reduce the trace size without losing useful information, by stopping the current record and starting a new one. Similarly, code that uses the ASM stub is free to start and stop several records.
When the recorder is ready, the Project Manager will insert a CD-ROM into the guest containing the input files of the scenario and the mandatory file for the autorun.
Generic arguments
The auto-record feature is accessible via the Project Manager Python API via one method per auto-record type. All the methods use a set of common arguments described here:
qemu_session_id: The id of the session used during the auto-record (you can retrieve it in the JSON when using thestart_qemu_snapshot_sessionmethod from the Project Manager Python API to start a snapshot)scenario_id: The id of the scenario where the record will be saved, it should not already contain a record.timeout_start: The maximum number of seconds to wait between the point where the recorder is ready and the start of the record (default:300,0for infinite).timeout_record: The maximum number of seconds to wait when recording before stopping it (default:60,0for infinite).autorun_binary: See the next section.autorun_args: See the next section
Each of these methods returns a JSON object with a task key containing the representation of a task. With this data and the get_task method of the Project Manager Python API, you can pull the task's data repeatedly to know when the auto-record is finished, and get the recorder_status (a status listed in the previous section) (See the Project Manager Python API examples).
How to wait the end of the auto-record
from reven2.preview.project_manager import ProjectManager

# Connecting to the Project Manager with its URL.
project_manager = ProjectManager(url="https://user:password@url.to.project.manager:8880")

# Launching the auto-record and retrieving its task
auto_record_task = project_manager.auto_record_XXX(
	# ...
)['task']
print("Launched auto-record task with id: %d" % auto_record_task['id'])

# Waiting for the end of the task
while not auto_record_task['finished']:
	sleep(1)

	# retrieve the task with updated information
	auto_record_task = pm.get_task(auto_record_task['id'])
	print("Recorder status: %s" % auto_record_task['display_recorder_status'])

print("Auto-record finished with status: %s" % auto_record_task['status'])
Autorun
When using either of the automatic recording methods, the Project Manager will allow you to automatically launch a binary, script or command on the guest. This allows for a fully automated record without any interaction from the user.
Note that although autorun isn't mandatory by itself, if you don't use it you will have to interact manually with the guest, e.g. to launch the binary you want to record.
To enable autorun on the guest, you will have to configure your guest to automatically execute the script contained in a CD-ROM following some instructions.
To enable the autorun on the automatic record, you will have to use these arguments:
autorun_binary: The binary, script or command to autorun on the guest when launching the auto-record. This could be either a string or the id of a file that was already uploaded to the Project Manager. Note that this will be launched from a bat script on Windows, so any valid batch command will also work, the same applies to Linux with bash.autorun_args: The arguments to give to theautorun_binary
NOTE: when the autorun is enabled, all the content of the folder will be copied to C:\reven\ on Windows and /tmp/reven on Linux and executed from there.
Examples
Launching a custom Windows script
project_manager.auto_record_XXX(
	autorun_binary="my_script.bat",
	autorun_args=[
		"1",
		"\"C:\\Program Files\"",
	]
	# ...
)
This example will launch the script my_script.bat also embedded in the CD-ROM like the following:
"my_script.bat" 1 "C:\Program Files"
Warning: To access my_script.bat from the guest, you need to put it in the scenario's input files
Launching a binary already in the guest
project_manager.auto_record_XXX(
	autorun_binary="C:\\Program Files\\VideoLAN\\VLC\\vlc.exe",
	# ...
)
This example will launch the executable C:\Program Files\VideoLAN\VLC\vlc.exe that is already present on the guest
Prepare the autorun
Windows
To allow autorun on Windows, you need to enable AutoPlay in the control panel (Hardware and Sound > AutoPlay) by setting "Software and games" to "Install or run program from your media".
If AutoPlay is disabled on your guest, you can still use a bat script which must be already launched on the guest when you start the automatic recording.
@echo off
title Wait CDROM Windows

:Main
timeout 2 > NUL
dir D:\ 1>NUL 2>NUL || GOTO Main

D:\autorun.bat
Warning: This script assumes that the CD-ROM will be mounted in D:, if it's not the case on your guest you should change it accordingly
Linux
Linux doesn't have an AutoPlay feature like Windows, so you will have to use a script to reproduce this feature. Like in Windows, this script must be already launched on the guest when you start the automatic recording if you want to use autorun.
#!/usr/bin/env bash

MOUNT_PATH=/media/cdrom0

while ! mount ${MOUNT_PATH} &> /dev/null
do
    sleep 0.3
done

source ${MOUNT_PATH}/autorun.sh
Warning: This script was tested on a Debian guest, it may require modification in order to work for other distributions
Binary recording
Requirements:
- The guest must be a Windows 10 x64
- The snapshot must be prepared
- The guest should be booted
- If you want to use the autorun, it must be configured.
To record a specific binary from the start of it until it exits, crashs or BSOD, you have to use the auto_record_binary method of the Project Manager Python API.
When using this auto-record, the recorder will resolve and watch specific Windows symbols, such as CreateProcessInternalW that is used to spawn new processes.
This method will record at least from the CreateProcessInternalW function and try to reduce the record by re-starting it at some important points using heuristics. Generally, for x64 binaries the first instruction of your trace will be the first instruction of the binary (on the entry point), but for some x64 binaries and x86 binaries the trace might instead start at the CreateProcessInternalW.
To indicate which binary you want to record, this method takes an extra parameter called binary_name, which should contain either the full name of the binary with the extension (and optionally with some parts of its path) or the id of a file that was previously uploaded to the Project Manager.
Note that autorun_binary and binary_name are different, autorun_binary is used to automatically execute something on the guest but won't start the record by itself, binary_name is an indication of which binary should be recorded.
Examples
project_manager.auto_record_binary(
	binary_name="my_binary.exe",
	# ...
)
Will record C:\my_directory\my_binary.exe but not C:\my_directory\my_second_binary.exe.
project_manager.auto_record_binary(
	binary_name="my_directory/my_binary.exe",
	# ...
)
Will record C:\my_directory\my_binary.exe but not C:\my_second_directory\my_binary.exe.
project_manager.auto_record_binary(
	binary_name="directory/my_binary.exe",
	# ...
)
Won't record C:\my_directory\my_binary.exe nor C:\my_second_directory\my_binary.exe.
Warning: Because the auto-record of a binary is based on the arguments of the function CreateProcessInternalW, you should provide a binary_name that is present in the command line used to launch it. See the next example.
project_manager.auto_record_binary(
	binary_name="my_directory/my_binary.exe",
	# ...
)
Here is some batch command lines to see when the record will be started and when not:
Rem This won't be recorded
cd my_directory
my_binary.exe

Rem This will be recorded
my_directory\my_binary.exe

Rem This won't be recorded
my_directory\my_binary

Rem This will be recorded
my_first_directory\my_directory\my_binary.exe

Rem This will be recorded
C:\my_first_directory\my_directory\my_binary.exe
If you want to use autorun to directly launch the binary instead of launching it yourself on the guest you can do something like the following:
project_manager.auto_record_binary(
	autorun_binary="my_binary.exe",
	binary_name="my_binary.exe",
	# ...
)
Or using ids:
project_manager.auto_record_binary(
	autorun_binary=5, # 5 is the id of the file "my_binary.exe" already uploaded to the Project Manager
	binary_name=5,
	# ...
)
Recording via ASM stubs
Requirements:
- If you want to use the autorun, it must be configured.
Automatic recording using ASM stubs allows you to directly control the record from the guest, e.g. to only record the execution of a specific function.
Using the ASM stubs described in the next section you are able to start, stop, etc the record automatically from within the VM. However, note that this ability comes with its own drawbacks, such as needing to modify a binary to insert the ASM stubs on the function you want to record.
NOTE: Auto-recording using ASM stubs should be OS agnostic, and was tested successfully on Windows 10 x64 and Debian Stretch amd64
Asm stubs
The ASM stub works by hijacking an instruction in the guest so that it is interpreted differently in the hypervisor when used with a specific CPU context. In REVEN v2, the ASM stub is the instruction int3 (bytecode 0xcc), when executed with a magic value in rcx.
So, when calling int3 you need to set these registers accordingly:
rcxto the magic value0xDECBDECBraxto the number id of the command you want to execute (see below)rbxto the argument to this command
The list of commands is:
0x0to start the record (if already started restart it). The argument must always be1for now.0x1to stop the record. No argument.0x2to commit the record (commiting the record save it to the scenario and stop the auto-record here). The argument must always be1for now.0x3to abort the record. The argument is eitherNULLor a pointer to a NUL-terminated string containing the reason of the abort.
Examples
Recording a function execution
If you have an executable my_binary.exe with these sources:
void function_to_record() {
	// ...
}

int main() {
	// ...

	// Start the record
	__asm__ __volatile__("int3\n" : : "a"(0x0), "b"(1), "c"(0xDECBDECB));

	function_to_record();

	// Stop/commit the record
	__asm__ __volatile__("int3\n" : : "a"(0x1), "c"(0xDECBDECB));
	__asm__ __volatile__("int3\n" : : "a"(0x2), "b"(1), "c"(0xDECBDECB));

	// ...
}
You can record it like the following:
project_manager.auto_record_asm_stub(
	autorun_binary="my_binary.exe",
	# ...
)
Recording two executables
If you want to record the execution of my_binary.exe and also my_second_binary.exe you can use something like the following.
With a binary start_record.exe:
int main() {
	// Start the record
	__asm__ __volatile__("int3\n" : : "a"(0x0), "b"(1), "c"(0xDECBDECB));
	return 0;
}
With a binary stop_record.exe:
int main() {
	// Stop/commit the record
	__asm__ __volatile__("int3\n" : : "a"(0x1), "c"(0xDECBDECB));
	__asm__ __volatile__("int3\n" : : "a"(0x2), "b"(1), "c"(0xDECBDECB));
	return 0;
}
With a script my_script.bat:
@echo off
C:\reven\start_record.exe

C:\reven\my_binary.exe
C:\reven\my_second_binary.exe

C:\reven\stop_record.exe
You will be able to record them by putting all these files in the scenario's input files and calling auto_record_asm_stub like the following:
project_manager.auto_record_asm_stub(
	autorun_binary="my_script.bat",
	# ...
)
REVEN v2 - Auto-record on Vbox
This document isn't as complete as the QEMU one, as the auto-record isn't a feature currently available for Virtualbox in the Project Manager Python API. However, this document will explain to you how to build your own auto-record on Vbox without any manual interaction with the guest.
This document covers the following topics:
- how to record in Vbox without using the keyboard shortcuts
- how to autorun your binaries in the guest.
Warning: This mode of operation is based on the way REVEN v1 was doing its auto-record, and is subject to change in a later version. Also note that this document won't talk about some advanced features of the auto-record using Vbox.
You can find a complete example of auto-record in Virtualbox in the Project Manager Python API examples called vbox-automatic-record.py.
ASM stubs
REVEN v1 has been using an hijacked instruction executed in the guest and interpreted differently in the hypervisor to control the record from the inside. This instruction is int3 with the magic value (0xDEADBABE) in rdx.
The commands are:
0xEFF1CAD6to start the record (when started you won't be able to restart it)0xEFF1CAD1to stop the record and stop the VM
Example
If you have a binary containing a function you want to record you can use ASM stubs:
void function_to_record() {
	// ...
}

int main() {
	// ...

	// Start the record
	unsigned ret;
	__asm__ __volatile__("int3\n" : "=a"(ret) : "a"(0xEFF1CAD6), "d"(0xDEADBABE));

	function_to_record();

	// Stop the record and the VM
	__asm__ __volatile__("int3\n" : : "a"(0xEFF1CAD1), "d"(0xDEADBABE));

	// Can't reach this point, the previous ASM stub should have stopped the VM
	__asm__ __volatile__("ud2");
}
All you have to do to record this function is to launch this binary in the guest and this will automatically start/stop the record.
Warning: The session should have been started in the step Record of the workflow of a scenario or from the Project Manager Python API using the method start_vbox_snapshot_session with the argument scenario containing the id of the scenario where you want to save your record.
Autorun
To enable autorun you will need to configure the guest in the same way as for QEMU autorun, and then follow the following instructions.
Windows
On Windows, AutoPlay (if configured correctly) will use the file autorun.inf at the root of the CD-ROM to know what to execute.
For example:
[autorun]
open=autorun.bat
shell\open\Command=autorun.bat
This will execute autorun.bat when the CD-ROM will be inserted.
If autorun.bat contains something like that:
@echo off
D:\my_binary.exe
With my_binary.exe containing the ASM stubs responsible for the start/stop of the record. You will just need to insert a CD-ROM into the guest containing autorun.inf, autorun.bat and my_binary.exe to auto-record what you want to record.
Linux
As Linux doesn't have the AutoPlay feature, you should have configured it to use a script which will execute automatically autorun.sh when the CD-ROM is mounted.
So, if autorun.sh contains something like that:
./my_binary
with my_binary containing the ASM stubs responsible for the start/stop of the record, you will just need to insert a CD-ROM into the guest containing autorun.sh and my_binary.exe to perform the auto-record.
Advanced usage
REVEN v1 used what we called preloaders that were responsible for starting the record at the start of the binary by using various methods:
- On Linux: using the
ptraceAPI to single step until the entry point is found - On Linux: using a
.sodynamically loaded withLD_PRELOADsetting a breakpoint at the entry point - On Windows: using the Windows API to start a suspended process and patch it
You can reproduce some of these methods using the ASM stubs explained in this document but the accuracy will probably not be sufficient to have the first instruction of the record be the first instruction of the binary.
REVEN Python API installation guide
Prerequisites
The supported platforms for installing the REVEN Python API are Debian Stretch 64 bits and Windows 10 64 bits. A working Python 2.7 or 3.5 (CPython) installation is also required.
Note for Debian: other dependencies will be installed over the course of this document and can be found in the
dependencies.sh file.
Python 2 / Python 3
Since Python 2 is due to reach its end-of-life in January 2020, we provide a Python 3 version of the API.
However, some tools currently require Python 2 (Axion, IDA). You will need to use the Python 2 version if you plan to
write scripts interacting with these tools.
On the REVEN server
If your Python development environment is on the same machine as your REVEN server, then the Python API is already
installed, and you just need to activate it.
Go to the install path of your REVEN package, then execute the following in a bash shell:
For Python2:
source sourceme_python2
For Python3:
source sourceme_python3
This results in activating a virtualenv with the Python API installed. To
deactivate it and get back to your original Python environment, either open a new shell, or run the deactivate
command in the current shell where the virtualenv was activated.
Note that the sourceme_python2 and sourceme_python3 files are bash scripts and may not work as intended when
sourced with different shells (fish, zsh, ...).
On a client workstation
To install on a client workstation, you will need to download the corresponding archive from the Download
page of the Project Manager.
Choose the package corresponding to the desired OS and Python version.
This section assumes that you are working from the root directory of the decompressed archive.
Virtualenv / user-wide / system-wide
Python development provides many ways of installing a Python package. This document covers the main installation options.
-
Using a virtualenv: A local installation that won't conflict with any other Python environment in your system. This is the most recommended way to make Python development, since it will guarantee that you won't break any existing Python script by accidentally upgrading a common dependency.
For a virtualenv installation, you'll first need to activate a virtualenv and then usepipnormally during the next section. -
A user-wide installation: This installation does not conflict with other users on the system, but you may have to manually setup the environment for your Python packages to be found.
For a user-wide installation, you'll need to usepipwith a--useroption after theinstallargument during the next section. -
A system-wide installation: This installation may conflict with other users or applications on the system, and requires root privileges. But after a system-wide installation, any user on the system will be able to use the REVEN Python API.
For a system-wide installation, you'll need to usepipwithrootprivilege on Debian Stretch (sudofor example), and normally on Windows during the next section.
Windows
First, be sure to have a Python 2.7 installation available with the pip utility installed. The default Python
installer typically provides this component.
- Step 1 (optional): create the virtualenv
The following Powershell lines will provide you with a virtualenv namedenvin your current working directory.
python.exe -m pip install virtualenv  # Not required if you already have virtualenv installed
python.exe -m virtualenv --system-site-packages env
env\Scripts\activate
- Step 2 (required): install the REVEN API
Paths are given relative to this current folder.
pip install (Get-Item dependencies\*.whl).FullName
pip install (Get-Item reven_api*.whl).FullName
pip install (Get-Item reven2*.whl).FullName
Debian Stretch
First, be sure to have a Python installation available with the corresponding pip utility installed.
- Step 1 (required): install the system dependencies
Paths are given relative to this current folder.
sudo ./dependencies.sh
- Step 2 (optional): create the virtualenv
Python2
sudo apt install virtualenv  # If virtualenv is not already installed
virtualenv --system-site-packages env2
source env/bin/activate
Python3
sudo apt install python3-venv  # If venv is not already installed
python3 -m venv --system-site-packages env
source env/bin/activate
- Step 3 (required): install the REVEN API
Paths are given relative to this current folder.
pip install dependencies/*.whl
pip install reven_api*.whl
pip install reven2*.whl
Next steps
If you successfully completed the previous steps, you should have a working REVEN Python API. Feel free to check out the Quickstart guide for a smooth kick-off.
Replay stage: Features & Resources
After recording a scenario, you will need to replay it in order to generate data required by the features you will use during the analysis stage.
In the replay stage, you are presented with a list of available REVEN's features. Resources data needed for each feature are discoverable by clicking on the feature row. In some features, there are also actions available.
By default, the Trace and Framebuffer features are selected.
NOTE: Axion cannot be launched if no trace data is available.
Features, Resources and Actions
Features match actual features available in Axion. For example, in order to visualize the Framebuffer in the Axion GUI, you will need to replay the Framebuffer feature during the replay stage.
Resources refer to the file(s) and data generated during the replay of a feature
in the replay stage. For example, the Backtrace feature replay output comprises
the "Stack Events" resource. Stack events regroup every data needed to display
the backtrace in Axion.
Actions are steps related to a feature that do not produce a resource. As such, these actions can be repeated.
For example, a current action is the Download light PDBs action, that allows to download external PDB. It can be useful to repeat this action if the symserver changes (e.g., contains new PDBs).
As such, an action is not necessarily mandatory to use a feature, but may improve the completeness of the feature (e.g., having more PDBs allows to resolve more symbols).
Available features and associated resources
The features present in the replay stage of the Project Manager are listed below:
| Feature | Resource(s) | Dependencies | Description |
|---|---|---|---|
| Trace | Trace |
| Contains all the transitions occurring during a scenario. |
| Framebuffer | Metadata |
| Allows displaying the framebuffer for any transition in a scenario in Axion. |
| Light OSSI | Light Filesystem & Kernel Description |
| Contains all the information to retrieve the OS-specific information in the Trace. |
| Memory History | Memory History |
| Contains every read and write memory access in a Trace. |
| Strings | Strings |
| Contains strings dynamically built during a scenario. |
| Backtrace | Stack Events |
| Contains the active stack frames for any transition in a Trace. |
| Fast search | Binary ranges & PC ranges |
| Provides indexes to speed up the Search feature. |
NOTE: Some features can be immutable. This means they cannot be generated or deleted (without deleting the scenario).
For example, in a Snapshot-less scenario (e.g: imported scenario), resources of the light OSSI feature are immutable, as we wouldn't be able to regenerate them, since OSSI generation requires a snapshot.
Resources & Features statuses
Features and Resources can have the following statuses:
: Compatible, means the resource is up-to-date and can be used with the current REVEN version.
: Ready, means the resource is not versioned then can be used with the current REVEN version.
: Compatible but generated with a different REVEN version, means the resource is not up-to-date but can still be used with the current REVEN version. To make the resource up-to-date, you need to replay it, doing so you will benefit from bug fixes and minor updates.
: Not compatible, means the resource is not compatible with the current REVEN version because of a breaking change. The current REVEN server will not be able to read it. You will need to re-generate the resource to make the associated feature available again.
: Replay failed, means the resource is not available because a problem occurred during the replay. Please consult the replay logs and/or try to replay the resource again.
: Replaying, means the resource is being generated.
: Pending, means the resource generation is waiting for some system resources or a dependent data resource to be available.
: Not generated, means the resource is not generated yet.
Actions statuses
Actions can have the following statuses:
: Success, means the action was ran successfuly once and could be re-run.
: Failure, means the action encountered a problem during the execution. Please consult the replay logs and/or try to replay the action again.
: Running, means the action is being executed.
: Pending, means the action is waiting for some system resources or a dependent data resource to be available.
: Not ran, means the action wasn't ran at all.
Tasks & Sessions
Tasks and Sessions are two concepts referring to actions run from the Project manager. They can be displayed and managed from a dedicated tab in the interface.
Tasks are background jobs such as a replay or a PDB download. Users can launch a task and continue to do their work.
Sessions are directly usable processes such as a started VM, a REVEN server or a running Axion GUI.
Tasks
Tasks aggregate resources replay, VM OS Specific Information (OSSI) preparation and PDBs download.
In the Tasks & Sessions tab, you can perform the following actions on a task:
- Cancel: kills a pending or running task.
- Details: shows a task's characteristics and logs.
- Delete: remove a task's characteristics and logs from the Task list. Be aware that logs can be very useful for bug report and support.
Task statuses
A task can have the following statuses:
: Success, means the task has been completed entirely without any error.
: Failure or Aborted,
means the task has been stopped before the expected end.
This can happen in 2 cases:
- Failed: something went wrong, probably an error occurred during the execution. Please refer to the logs.
- Aborted: task has been canceled on purpose before completion.
: Started, means the task is running.
: Pending, means the task is not started yet. Two reasons can put a task in pending state: waiting for either system resources or replay dependencies to become available.
Sessions
Sessions aggregate interactive processes launched from the Project Manager: REVEN server, Axion and VMs.
In the Tasks & Sessions tab, you can perform the following actions on a session:
- Stop: stops a running session.
- Details: shows a session's characteristics and logs.
- Delete: remove a session's characteristics and logs from the Session list. Be aware that logs can be very useful for bug report and support.
Session statuses
A session can have the following statuses:
: Started, means the session is up and running.
: Stopped,
means the session has been stopped. Either the user closed/killed it manually or
they stopped it from the Tasks & Sessions tab via the Stop button.
