RvnKdBridge
This program allows you to connect WinDbg (aka KD) to a REVEN server. When doing so, the REVEN trace will appear as a live, running system to the WinDbg client. This way you get the best of both worlds:
- High level semantic information and navigation with WinDbg.
- Timeless availability of your scenario along with all features of REVEN available through its API and its GUI.
Requirements on the REVEN scenario
For the WinDbg integration to work, your trace must have full OS Specific Information (OSSI).
Note that it is not required to start the VM with /debug when preparing it for recording.
Installation
You can find RvnKdBridge in the DOWNLOADS section of the Project Manager. Extract it anywhere your user can write a file.
Usage instructions
You will use RvnKdBridge in order to connect WinDbg to a REVEN trace. This program is intended to run on Windows alongside your WinDbg client: you will connect it to the REVEN trace, and it will create a named pipe WinDbg can connect to. This is similar to debugging a VM's kernel.
Here is how the programs connect together, with example values for the connection parameters:
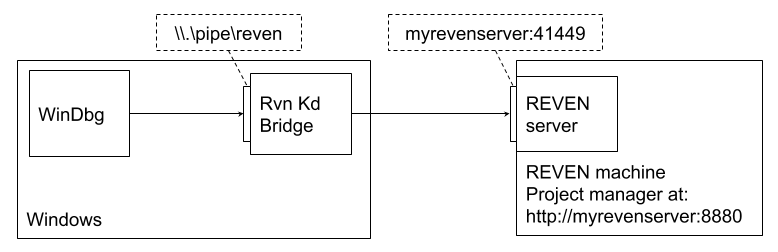
Make sure that your network configuration allows you to connect to the REVEN trace.
Starting the bridge
Launch the program RvnKdBridge.exe. There are multiple fields to fill in.
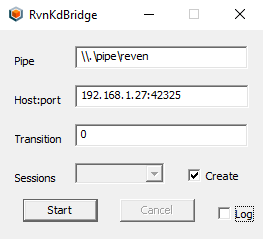
Pipe: Path of the named pipe to create. The format is\\.pipe\<mypipename>, for example\\.pipe\reven.Host:port: Description of the project's server & port. The format is<hostname>:<port>.- The host is the address of your server
- To find the port, you can go to the Analyze page for the scenario you want to connect with, and the port number will be displayed in the label above the buttons (
REVEN running on port xxxx):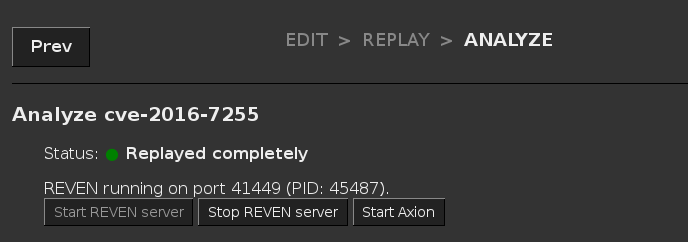
Transition: At which transition in the trace the bridge will start. WinDbg will see the REVEN trace as a VM stopped at this point in time for debugging.Createcheckbox: Whether or not a new synchronization session for Axion should be created.
Connecting WinDbg
The next step is to connect WinDbg to the named pipe you specified. The procedure differs slightly between WinDbg x64 and WinDbg Preview.
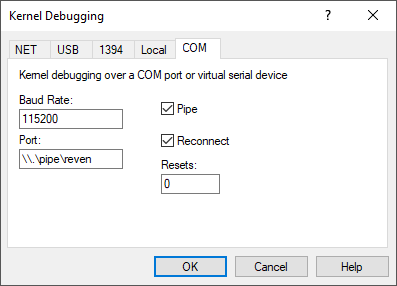
In WinDbg x64, follow the steps below:
- Click on
File - then
Kernel Debug. - Select the
COMtab, - Check
Pipe. - In the
Porttext field, enter the name of the pipe. - Finally, click on
OK.
In WinDbg Preview, follow the steps below:
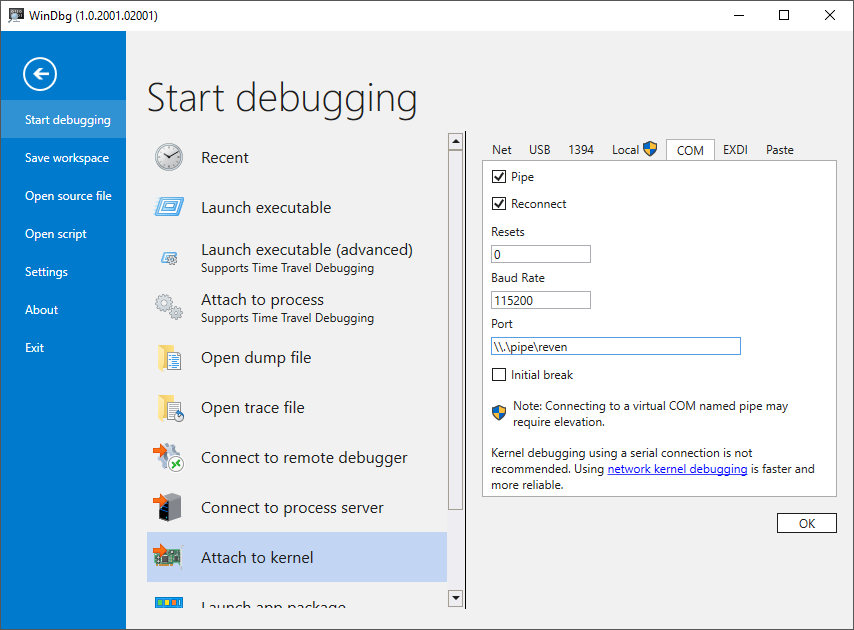
- Click on
File Start debugging- then
Attach to kernel. - Select the
COMtab, - Check
Pipe. - In the
Porttext field, enter the name of the pipe. - Finally, click on
OK.
Using WinDbg on a REVEN trace
You can now use WinDbg as if you were connected to a live running VM in kernel mode.
Reading the state
Most commands that read the current state of the debuggee will work. For example:
.reloadis necessary, thenlmk,dt.tlist,!peb,!handle,!time- Reading memory, especially reading structured data
- etc.
Note that when debugging at the start of a trace, some commands (callstack or !peb for example) may return unexpected results. This appears to be due to the state at the start of the trace (exception handling in the system process).
Browsing the trace
- You can use basic WinDbg tracing and stepping commands to
move in the trace. For simple commands, like
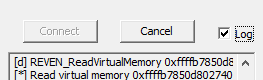
t, WinDbg will go automatically to the next transition. More complex commands might refer to events outside the trace, such as stepping out (gu) of a function that never returns. In such cases, the bridge will ask the user to enter the desired target transition. - You can set breakpoints using the
usual breakpoint commands. The
resumecommand (g) can then be used to jump to the next transition where a breakpoint is hit. If none of the breakpoints are hit in the trace after the current transition, then the bridge will ask the user to enter the desired target transition. In particular, if there are no breakpoint enabled, thengwill always allow to jump to a transition manually.
Synchronization with Axion
Once connected to the REVEN server, you can use the Sessions combo box to select a session name.
You can then select the same session name in an Axion GUI client connected to the same REVEN server,
in order to synchronize the Axion GUI with WinDbg.
This way, each time a new transition is selected in WinDbg (for instance using commands to browse the trace), the same
transition will also be selected in Axion.
If you checked the Create checkbox next to the Sessions combo box, then a fresh session name will be generated
by the bridge upon connecting to the server.
Current known limitations/issues
The following commands are currently not supported by the bridge:
- reverse step in / into / out
Moreover, commands that would end up writing to the debugged system do not make sense in the context of REVEN, since we're working on a read-only trace. Hence, the following commands are not supported:
- changing registers
- writing to memory
- any command that would result in a write to the debuggee's state, such as changing process via
.process /i
Troubleshooting
Here are answers to common errors you might encounter when using RvnKdBridge.
Bridge cannot connect to the trace
First, double-check that you are providing the right address and port. Note that the port is reported when starting a REVEN server, in the Analyze section under the Project Manager's Scenario tab.
Then, make sure your network setup allows communication between your Windows machine and the REVEN server.
WinDbg cannot connect to bridge
If WinDbg shows the error Kernel debugger failed initialization, Win32 error 0n1, make sure you did check Pipe while configuring the named pipe.
You may also get spurious errors such as Kernel debugger failed initialization, Win32 error 0n231 "All pipe instances are busy." - WinDbg might still be connected. You can ignore this error.
Bridge can connect to trace, but fails to recognize kernel
RvnKdBridge has been tested on various kernels and traces, ranging from Windows 7 up to Windows 10 RS6. Still, you might encounter conditions where the bridge may not work: required memory areas are unexpectedly not mapped, or the kernel is not supported.
The logs window might help you troubleshoot the problem.
If you find a kernel and/or a trace on which the bridge does not work, please try the following actions on the VM you recorded the scenario on:
- Deactivate the pagination file
- Reboot the VM
- Once fully rebooted, record a new, small trace and try to connect the bridge again.
If these actions do not help, please contact the support by copying the logs, details about the scenario such as kernel version, or ideally a very small scenario displaying the problem.