REVEN Python API quick start
With the REVEN Python API, reverse engineers can automate the analysis of a scenario by scripting.
Python API reference documentation
- About this document
- Installation
- Basic usage
- Main concepts
- Feature overview
- Going further
About this document
This document is a quick start guide to the REVEN Python API. The REVEN Python API can be used to automate several aspects of REVEN:
- The recording/replay workflow (Workflow Python API), only available in the Enterprise Edition.
- The analysis of an already replayed scenario (Analysis Python API).
This document focuses solely on the Analysis Python API. It covers the following topics:
- Installation
- Basic usage
- Main concepts
- Overview of the available features
Along the way, this document provides some simple recipes you can use to automate various tasks.
You can follow along the code examples of this document by downloading from our website the CVE-2020-15999 (Windows 7) scenario and then importing it into REVEN. You might need a dozen of minutes and 11GB of disk space for replaying this scenario.
Installation
Please refer to the Installation page for more information on installing the Python API.
You can also use the Jupyter notebook integration to use the API.
Basic usage
Once you've installed the Python API (see the Installation document), you're ready for your first script.
Import the reven2 package:
>>> # Importing the API package
>>> import reven2
Connecting to a server
To use the Python API, you have to connect to a REVEN server started on the scenario you want to analyze. To do this, you must provide the host and port of your REVEN server:
>>> # Connecting to a reven server
>>> hostname = "localhost"
>>> port = 13370
>>> server = reven2.RevenServer(hostname, port)
>>> server
Reven server on CVE-2020-15999-Windows7 (localhost:13370) [connected]
If you are using the Python API from the same machine than the REVEN server itself, then the host is "localhost",
otherwise it is the address of your server.
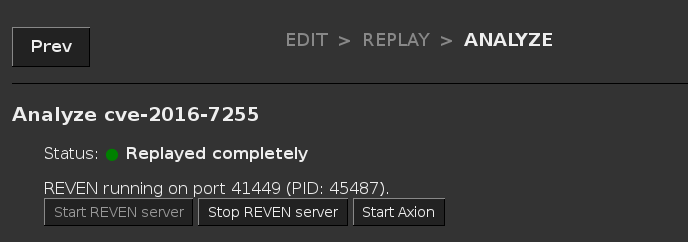
To find the port, you can go to the Analyze page for the scenario you want to connect with, and the port number will be
displayed in the label above the buttons (REVEN running on port xxxx):
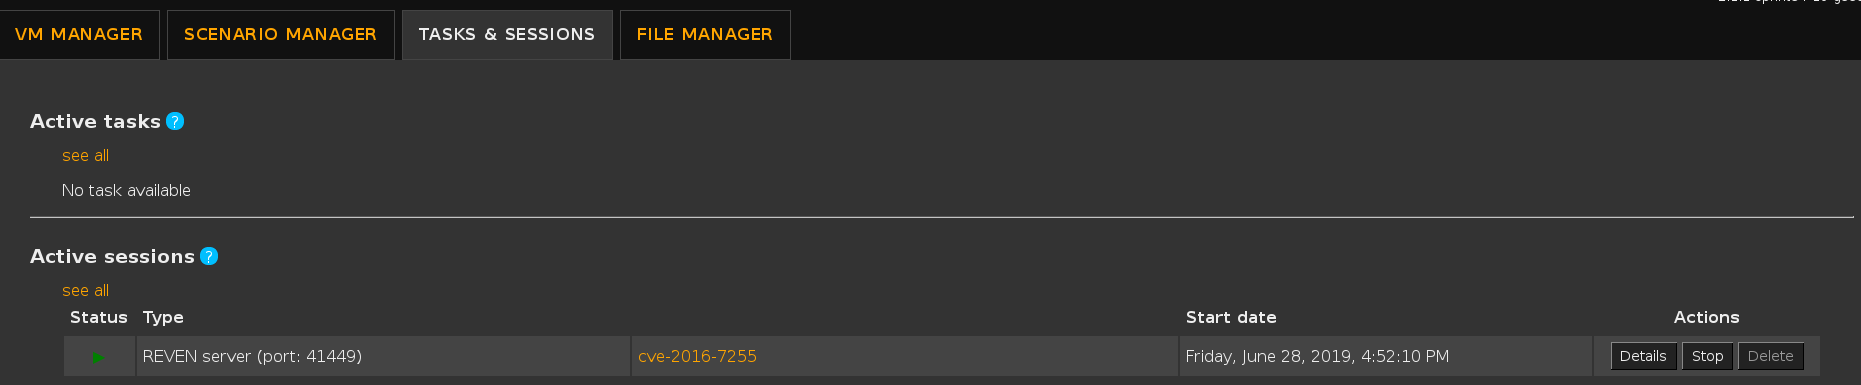
Alternatively, you can find the port in the Active sessions list:
Finally, if you have an Axion client connected to your REVEN server, you can find the port in the titlebar of the Axion window:

Connecting to a server from the scenario's name
NOTE: This section only applies to REVEN enterprise edition.
You can use a feature of the Workflow API to get a connection to a server from the scenario's name, rather than by specifying a port:
>>> from reven2.preview.project_manager import ProjectManager
>>> pm = ProjectManager("http://localhost:8880")  # URL to the REVEN Project Manager
>>> connection = pm.connect("CVE-2020-15999-Windows7")  # No need to specify "13370"
>>> server = connection.server
>>> server
Reven server on CVE-2020-15999-Windows7 (localhost:13370) [connected]
This is useful, as the server port will typically change at each reopening of the scenario, while the scenario name remains the same.
If no server is open for that particular scenario when executing the ProjectManager.connect method call, then a new one will be started.
Root object of the API, tree of objects
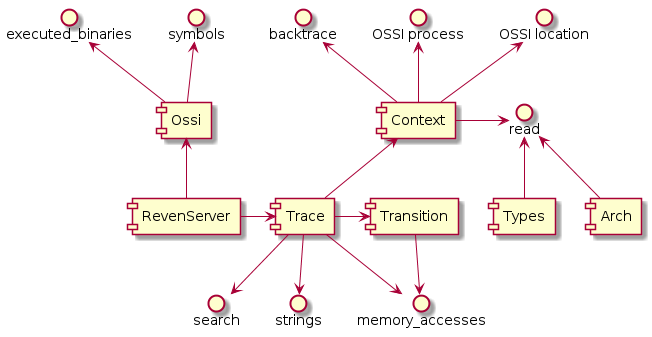
The RevenServer instance serves as the root object of the API from where you can access all the features of the API.
The following diagram gives a high-level view of the Python API:
For instance, from there you can get the execution trace and ask for the total number of transitions in the trace:
>>> # Getting the trace object
>>> trace = server.trace
>>> # Getting the number of transitions in the trace
>>> trace.transition_count
158693449
In your Python interactive shell, you can also use the help built-in function to directly access the documentation while coding (see the official Python documentation for more details on this function).
We recommend using a feature-rich shell like ipython or bpython to benefit from e.g. auto-completion while using the Python API.
Main concepts
Getting a point in time
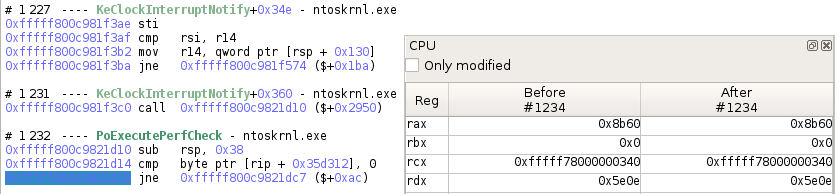
As is visible in Axion, all instructions are identified by a single unique integer, called the transition id. The transition id starts at 0 for the first instruction in the trace, and is incremented by 1 for each consecutive instruction.
NOTE: We are using the term Transition rather than Instruction here, because technically, not all Transitions in
the trace are Instructions: when an interrupt or a fault occurs, it is also denoted by a Transition that changed the
Context, although no Instruction was executed. Similarly, instructions that execute only partially (due to being
interrupted by e.g. a pagefault) are not considered as normal Instructions. You can see a Transition as a
generalized Instruction, i.e. something that modifies the context.
Getting a transition
You can get interesting transition numbers from Axion's Trace view.
>>> # Getting a transition
>>> transition = trace.transition(1234)
>>> # Displays the transition as seen in Axion
>>> print(transition)
#1234 lock and qword ptr ds:[rdi+0x40], 0x0
>>> # Is this transition an instruction?
>>> transition.instruction is not None
True
Getting a context
A Transition is representing a change in the trace, while Contexts represent a state in the trace.
From a transition, you can get either the context before the transition was applied, or the context after the transition was applied:
>>> # Comparing rip before and after executing an instruction
>>> ctx_before = transition.context_before()
>>> ctx_after = transition.context_after()
>>> "0x{:x}".format(ctx_before.read(reven2.arch.x64.rip))
'0xfffff800028cc175'
>>> "0x{:x}".format(ctx_after.read(reven2.arch.x64.rip))
'0xfffff800028cc17b'

>>> # Directly getting a context from the trace object
>>> trace.context_before(0x1234) == trace.transition(0x1234).context_before()
True

>>> # Getting a transition back from a context
>>> transition.context_before().transition_after() == transition
True
Reading a context
A common operation on a Context instance is to read the state of the CPU registers as well as memory.
The API provides the read method on Context, that allows to read from a source.
Getting a register or an address
To read from a register source, you can reference elements exposed by the arch package:
>>> import reven2.arch.x64 as regs
>>> ctx = transition.context_before()
>>> ctx.read(regs.rbx)
18446738026434307840
>>> ctx.read(regs.bl)
0
>>> # Are we in kernel land?
>>> ctx.read(regs.cs) & 3 == 0
True
To read from a source address, use the address module to construct addresses:
>>> # Comparing the bytes at RIP in memory with the bytes of the instruction
>>> from reven2.address import LogicalAddress, LinearAddress, PhysicalAddress
>>> rip = ctx.read(regs.rip)
>>> instruction = transition.instruction
>>> ctx.read(LogicalAddress(rip, regs.cs), instruction.size) == instruction.raw
True
Reading as a type
The types package of the API provides classes and instance dedicated to the representation of data types.
They allow to read a register or some memory as a specific data type.
>>> from reven2 import types
>>> # Reading rax as various integer types
>>> ctx.read(regs.rbx, types.U8)
0
>>> ctx.read(regs.rbx, types.U16)
42752
>>> ctx.read(regs.rbx, types.I16)
-22784
>>> # Reading in a different endianness (default is little endian)
>>> ctx.read(regs.rbx, types.BigEndian(types.U16))
167
>>> # Reading some memory as a String
>>> ctx.read(LinearAddress(0x7fef2b09298), types.CString(encoding=types.Encoding.Utf8, max_character_count=1000))
'../../services/network/network_service.cc'
>>> # Reading the same memory as a small array of bytes
>>> list(ctx.read(LinearAddress(0x7fef2b09298), types.Array(types.U8, 4)))
[46, 46, 47, 46]
>>> # Dereferencing rsp + 0x20 in two steps
>>> addr = LogicalAddress(0x20) + ctx.read(regs.rsp, types.USize)
>>> ctx.read(addr, types.U64)
0
>>> # Dereferencing rsp + 0x20 in one step
>>> ctx.deref(regs.rsp, types.Pointer(types.U64, base_address=LogicalAddress(0x20)))
0
Identifying points of interest
One of the first tasks you need to perform during an analysis is finding an interesting point from where to start the analysis. The API provides some tools designed to identify these points of interests.
Getting and using symbol information
A typical starting point for an analysis is to search points where a specific symbol is executed. In the API, this is done in two steps:
- Identify the symbol in the available symbols of the trace.
- Search for the identified symbol.
For the first step, you need to recover the OS Semantics Information (OSSI) instance tied to your RevenServer instance:
>>> # Recovering the OSSI object
>>> ossi = server.ossi
Note that for the OSSI feature to work in the API, the necessary OSSI resources must have been generated. Failure to do so may result in several of the called methods to fail with an exception. Please refer to the documentation of each method for more information.
From there you can use the methods of the Ossi instance to get the binaries that were executed in the trace, and all
the symbols of these binaries.
Note that each of these methods, like all methods returning several results of the API, return Python generator objects.
>>> # Getting the first binary named "ntoskrnl.exe" in the list of executed binaries in the trace
>>> ntoskrnl = next(ossi.executed_binaries("ntoskrnl.exe"))
>>> ntoskrnl
Binary(path='c:/windows/system32/ntoskrnl.exe')
>>> # Getting the list of the symbols in "ntoskrnl.exe" containing "NtCreateFile"
>>> nt_create_files = list(ntoskrnl.symbols("NtCreateFile"))
>>> nt_create_files
[FunctionSymbol(binary='ntoskrnl', name='NtCreateFile', rva=0x37fcbc), FunctionSymbol(binary='ntoskrnl', name='VerifierNtCreateFile', rva=0x521b70)]
Once you have a symbol or a binary, you can use the search feature to look for contexts whose rip location
matches the symbol or binary.
>>> # Getting the first context inside of the first call to `NtCreateFile` in the trace
>>> create_file_ctx = next(trace.search.symbol(nt_create_files[0]))
>>> create_file_ctx
Context(id=106965747)
>>> # Getting the first context executing the `chrome.exe` binary
>>> chrome = next(ossi.executed_binaries("chrome.exe"))
>>> chrome_ctx = next(trace.search.binary(chrome))
>>> chrome_ctx
Context(id=2291077)
For any context, you can request the current OSSI location and process:
>>> # Checking that the current symbol is NtCreateFile
>>> create_file_ctx.ossi.location()
Location(binary='ntoskrnl', symbol='NtCreateFile', address=0xfffff80002bd4cbc, base_address=0xfffff80002855000, rva=0x37fcbc)
>>> # Getting the current process
>>> create_file_ctx.ossi.process()
Process(name='chrome.exe', pid=1784, ppid=924, asid=0x11b75000)
>>> # When the symbol is unknown it is not displayed and set to None.
>>> # This doesn't happen in the sample scenario though.
>>> # trace.context_before(unknown_symbol).ossi.location()
>>> # trace.context_before(unknown_symbol).ossi.location().symbol is None

>>> # When the whole location is unknown it is set to None
>>> trace.context_before(171814).ossi.location() is None
True
You can also request the location corresponding to a different (currently mapped) cs virtual address:
>>> # Requesting the 'NtCreateFile' symbol location from a context at a different location
>>> ctx.ossi.location()
Location(binary='ntoskrnl', symbol='KiDeferredReadyThread', address=0xfffff800028cc175, base_address=0xfffff80002855000, rva=0x77175)
>>> ctx.ossi.location(0xfffff80002bd4cbc)
Location(binary='ntoskrnl', symbol='NtCreateFile', address=0xfffff80002bd4cbc, base_address=0xfffff80002855000, rva=0x37fcbc)
>>> # Moving a bit changes the rva
>>> hex(ctx.ossi.location(0xfffff80002bd4cdf).rva)
'0x37fcdf'
Searching executed addresses in the trace
If you don't have a symbol attached to your address, you can also search for a specific address using the search function:
>>> # Searching for an executed address we saw in `chrome.exe`
>>> chrome_ctx == next(trace.search.pc(0x140009700))
True
Searching for strings in the trace
You can use the strings feature to search points in the trace where strings are first accessed or created:
>>> # Looking for a string containing "Network"
>>> string = next(trace.strings("Network"))
>>> string
String(data='../../services/network/network_service.cc\\0', size=42, address=LinearAddress(offset=0x7fef2b09298), first_access=#230200 movzx r9d, byte ptr ds:[rdx+rax*1], last_access=Transition(id=136646061), encoding=<Encoding.Utf8: 0>)
>>> # Getting the first 4 memory accesses for the string
>>> import itertools
>>> for access in itertools.islice(string.memory_accesses(), 4):
...     print(access)
...
[#230200 movzx r9d, byte ptr ds:[rdx+rax*1]]Read access at @phy:0x39206298 (virtual address: lin:0x7fef2b09298) of size 1
[#230207 movzx r9d, byte ptr ds:[rdx+rax*1]]Read access at @phy:0x39206299 (virtual address: lin:0x7fef2b09299) of size 1
[#230214 movzx r9d, byte ptr ds:[rdx+rax*1]]Read access at @phy:0x3920629a (virtual address: lin:0x7fef2b0929a) of size 1
[#230221 movzx r9d, byte ptr ds:[rdx+rax*1]]Read access at @phy:0x3920629b (virtual address: lin:0x7fef2b0929b) of size 1
Manually iterating in the trace
Another way of searching interesting points is by iterating over contexts or transitions, and then looking for various information by inspecting the context or transition. Beware that if you iterate on a large portion of the trace, it may take a very long time to complete, so prefer the predefined search APIs that use optimized indexes whenever it is possible.
>>> # Finding first instruction whose mnemonic is swapgs
>>> # Warning: this example may take some time to execute
>>> def find_mnemonic(trace, mnemonic, from_transition=None, to_transition=None):
...     for i in range(from_transition.id if from_transition is not None else 0,
...                    to_transition.id if to_transition is not None else trace.transition_count):
...         t = trace.transition(i)
...         if t.instruction is not None and mnemonic in t.instruction.mnemonic:
...             yield t
...
>>> next(find_mnemonic(trace, "swapgs"))
Transition(id=20)
Combining the predefined search APIs with manual iteration allows to iterate over a smaller portion of the trace to extract useful information:
>>> # Finding all files that are created in a call to NtCreateFile
>>> def read_filename(ctx) -> str:
...     # The third argument to the call is an _OBJECT_ATTRIBUTES structure, the filename is stored in:
...     # _OBJECT_ATTRIBUTES->ObjectName.Buffer
...     ty : types.Struct = ntoskrnl.exact_type("_OBJECT_ATTRIBUTES")
...     object_attribute: StructInstance = ctx.deref(regs.r8, types.Pointer(ty))
...     unicode_string = object_attribute.field("ObjectName").deref_struct()
...     return unicode_string.field("Buffer").deref_str(
...         types.CString(encoding=types.Encoding.Utf16, max_size=unicode_string.field("Length").read_int())
...     )
...
>>> for (index, ctx) in enumerate(trace.search.symbol(nt_create_files[0])):
...     if index > 5:
...         break
...     print("{}: {}".format(ctx, read_filename(ctx)))
...
Context before #106965747: \Device\Afd\Endpoint
Context before #132588377: \??\C:\Users\IEUser\AppData\Local\Google\Chrome\User Data\Default\Cache\f_000005
Context before #137264445: \??\C:\Users\IEUser\AppData\Local\Google\Chrome\User Data\Default\Cache\f_000005
Context before #137309118: \??\C:\Users\IEUser\AppData\Local\Google\Chrome\User Data\Default\Cache\f_000005
Moving in the trace
Once you identified point(s) of interest, the next step in the analysis is to navigate by following data from these points.
The API provides several features that can be used to do so.
Using the memory history
The main way to use the memory history in the trace is to use the Trace.memory_accesses method.
This method allows to look for the next access to some memory range, starting from a transition and in a given
direction:
>>> # Getting the next access to any memory range from the current point
>>> memhist_transition = trace.transition(40818)
>>> access = next(trace.memory_accesses(from_transition=memhist_transition))
>>> access
MemoryAccess(transition=Transition(id=40820), physical_address=PhysicalAddress(offset=0x122c1270), size=4, operation=MemoryAccessOperation.Read, virtual_address=LinearAddress(offset=0xb31270))
>>> # Choosing a memory range to track
>>> memory_range = access.virtual_range
>>> memory_range
MemoryRange(address=LinearAddress(offset=0xb31270), size=4)
>>> # Getting the next access to that memory range from the current point
>>> next(trace.memory_accesses(address_range=memory_range, from_transition=memhist_transition))
MemoryAccess(transition=Transition(id=40820), physical_address=PhysicalAddress(offset=0x122c1270), size=4, operation=MemoryAccessOperation.Read, virtual_address=LinearAddress(offset=0xb31270))
>>> # Getting the previous access to that memory range from the current point
>>> next(trace.memory_accesses(address_range=memory_range, from_transition=memhist_transition, is_forward=False))
MemoryAccess(transition=Transition(id=39956), physical_address=PhysicalAddress(offset=0x122c1270), size=4, operation=MemoryAccessOperation.Read, virtual_address=LinearAddress(offset=0xb31270))
>>> # Getting all accesses to that memory range in the trace
>>>
>>> # We first need to translate the range to physical addresses because the memory range is translated at the first
>>> # context of the search, which could result in different ranges being searched if the same virtual address is
>>> # mapped to different physical pages over the course of the trace.
>>> physical_ranges = list(memory_range.translate(memhist_transition.context_before()))
>>> physical_ranges
[MemoryRange(address=PhysicalAddress(offset=0x122c1270), size=4)]
>>> for access in itertools.islice(trace.memory_accesses(address_range=physical_ranges[0]), 5):
...     print(access)
...
[#26661 cmp dword ptr ds:[r15+0x80], 0x0]Read access at @phy:0x122c1270 (virtual address: lin:0xb31270) of size 4
[#27436 cmp dword ptr ds:[r14+0x80], 0x0]Read access at @phy:0x122c1270 (virtual address: lin:0xb31270) of size 4
[#31317 cmp dword ptr ds:[r14+0x80], 0x0]Read access at @phy:0x122c1270 (virtual address: lin:0xb31270) of size 4
[#32181 cmp dword ptr ds:[rsi+0x78], 0x0]Read access at @phy:0x122c1270 (virtual address: lin:0xb31270) of size 4
[#34107 cmp dword ptr ds:[r15+0x80], 0x0]Read access at @phy:0x122c1270 (virtual address: lin:0xb31270) of size 4
Note that the memory history works with physical addresses under the hood. Although it accepts virtual addresses in input, the range of virtual addresses in translated to physical ranges before querying the memory history. As a result, the vitual address range needs to mapped at the context of the translation for the call to succeed.
A secondary method to use is the Transition.memory_accesses method that provides all the memory accesses that occurred
at a given transition.
>>> # Getting all memory that is accessed during a "rep mov" operation
>>> rep_tr = trace.transition(533320)  # found with "find_mnemonic"
>>> print(rep_tr)
#533320 rep movsq
>>> [(access.virtual_address, access.size) for access in rep_tr.memory_accesses()]
[(LinearAddress(offset=0x38f140), 8), (LinearAddress(offset=0x38ed60), 8), (LinearAddress(offset=0x38f148), 8), (LinearAddress(offset=0x38ed68), 8), (LinearAddress(offset=0x38f150), 8), (LinearAddress(offset=0x38ed70), 8), (LinearAddress(offset=0x38f158), 8), (LinearAddress(offset=0x38ed78), 8), (LinearAddress(offset=0x38f160), 8), (LinearAddress(offset=0x38ed80), 8), (LinearAddress(offset=0x38f168), 8), (LinearAddress(offset=0x38ed88), 8)]
Using debugger commands
From any transition, you can move to the beginning/end of the current function by calling the Transition.step_out
method:
>>> after_ret_tr = rep_tr.step_out()
>>> print(after_ret_tr)
#683177 mov qword ptr ss:[rsp+0x98], rax
>>> call_tr = rep_tr.step_out(is_forward=False)
>>> print(call_tr)
#533289 call 0x7feff3de970
This is useful in particular to, for instance, get to a transition where the return value of the function is available, or get to a transition where the parameters of the function are available:
>>> # Find the first parameter and the return value from any transition.
>>> #
>>> # Note: this assumes standard Windows 64-bit calling conventions, and that the there is one pointer-sized argument and
>>> # one pointer-sized return value. For more precise signature recovery, see reven2-ltrace.
>>> def print_first_parameter_and_return_value(tr: reven2.trace.Transition) -> None:
...     loc = tr.context_before().ossi.location()
...     if loc is None:
...         loc = "???"
...     first_tr = tr.step_out(is_forward=False)
...     if first_tr is None:
...         first_param = "???"
...     else:
...         first_param = hex(first_tr.context_before().read(reven2.arch.x64.rcx))
...     last_tr = tr.step_out()
...     if last_tr is None:
...         ret = "???"
...     else:
...         ret = hex(last_tr.context_before().read(reven2.arch.x64.rax))
...     print(f"{loc}: first_param={first_param}, ret={ret}")
...
>>> print_first_parameter_and_return_value(rep_tr)
rpcrt4!Invoke+0x35: first_param=0x7fefc1d18f4, ret=0x0
Similarly, the Transition.step_over method can be used to skip a function on a call or ret instruction:
>>> call_tr.step_over() == after_ret_tr
True
>>> after_ret_tr.step_over(is_forward=False) == call_tr
True
Using the backtrace
For any context, you can get the associated call stack by calling the Context.stack property:
>>> # Getting the call stack
>>> rep_ctx = rep_tr.context_before()
>>> stack = rep_ctx.stack
>>> stack
Stack(Context=533320)
>>> # Displaying a human-readable backtrace
>>> print(stack)
[0] #533289 - rpcrt4!Invoke
[1] #520148 - rpcrt4!?Ndr64StubWorker@@YAJPEAX0PEAU_RPC_MESSAGE@@PEAU_MIDL_SERVER_INFO_@@PEBQ6AJXZPEAU_MIDL_SYNTAX_INFO@@PEAK@Z
[2] #520132 - umpnpmgr!NdrServerCallAll
[3] #520125 - rpcrt4!DispatchToStubInCNoAvrf
[4] #520052 - rpcrt4!RPC_INTERFACE::DispatchToStubWorker
[5] #519947 - rpcrt4!LRPC_SCALL::DispatchRequest
[6] #518073 - rpcrt4!LRPC_SCALL::HandleRequest
[7] #517417 - rpcrt4!LRPC_SASSOCIATION::HandleRequest
[8] #517381 - rpcrt4!LRPC_ADDRESS::HandleRequest
[9] #516369 - rpcrt4!LRPC_ADDRESS::ProcessIO
[10] #516330 - rpcrt4!LrpcIoComplete
[11] #516148 - ntdll!TppAlpcpExecuteCallback
[12] ??? - ntdll!RtlpCheckHeapSignature+0x75
From there, you can use the backtrace to navigate in at least two ways:
- By going back to the caller of the current frame.
>>> # Finding back the caller transition if it exists
>>> print(next(stack.frames()).creation_transition)
#533289 call 0x7feff3de970
- By going back to the previous stack. This allows for instance to switch from kernel land to user land, or to find/skip syscalls when necessary.
>>> print(stack.prev_stack())
[0] ??? - ntoskrnl!KiSystemCall64+0x293
Feature overview
The following table offers a simple comparison between widgets and features of Axion and Python API methods:
| Widget | API |
|---|---|
| CPU | Context.read |
| Trace view | Transition, Context.ossi.location, Context.ossi.process |
| Hex dump | Context.read |
| Memory History | Trace.memory_accesses, Transition.memory_accesses |
| Search | Trace.search |
| Backtrace | Context.stack |
| String | Trace.strings |
| Taint | Available in preview: preview.taint |
| Prototypes | Available in preview: preview.prototypes |
Going further
This concludes the Python API quick start guide. For further information on the Python API, please refer to the following documents:
-
Python API analysis examples that are distributed in the
Downloadspage of the REVEN Project Manager. These scripts demonstrate the possibilities offered by the Python API through more elaborate examples. Their documentation is available here. -
IDA Python API examples that are distributed in the
Downloadspage of the REVEN Project Manager. These scripts showcase the IDA compatibility of the Python API, that is, the simple capability of using the Python API from IDA:>>> import reven2 # This works from IDA, too -
The full Python API reference documentation