Troubleshooting
Here are answers to common errors you might encounter when using RvnKdBridge and the integration of WinDbg in REVEN.
Bridge cannot connect to the trace
First, double-check that you are providing the right address and port. See the section determining the port.
Then, make sure your network setup allows communication between your Windows machine and the REVEN server on this port.
WinDbg cannot connect to bridge
If WinDbg shows the error Kernel debugger failed initialization, Win32 error 0n1, make sure you did check Pipe while configuring the named pipe.
You may also get spurious errors such as Kernel debugger failed initialization, Win32 error 0n231 "All pipe instances are busy." - WinDbg might still be connected, in which case you can ignore this error.
Bridge connects, but fails to recognize kernel
RvnKdBridge has been tested on various kernels and traces, ranging from Windows 7 up to Windows 10 RS6. Still, you might encounter conditions where the bridge may not work: required memory areas are unexpectedly not mapped, or the kernel is not supported.
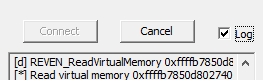
The logs window might help you troubleshoot the problem.
If you find a VM or a trace on which the bridge does not work, please try the following actions on the VM:
- Deactivate the pagination file
- Reboot the VM
- Once fully rebooted:
- Either try connecting the bridge to the VM debugger connection,
- Or record a small scenario on that VM and try connecting the bridge to the trace.
If these actions do not help, please contact the support by copying the logs, details about the VM such as kernel version, or ideally a very small scenario displaying the problem.
Trace analysis: the debugger commands (e.g. g) always prompt the bridge to ask for a transition manually
- If error messages such as "Could not set breakpoint" or "Could not resume" appear in the log, then the resources required by the debugger might be missing for your scenario. Check that the "Stack events" (in the "Backtrace & Callstack" feature) and the "PC Ranges" (in the "Fast search" feature) resources have been replayed for your scenario.
- If there are no breakpoints defined, or the defined breakpoints are never hit in the remainder of the trace, this is the expected behavior.