Analyze your first scenario
Now that we have a first scenario, it is time to take a look at it.
The analyze page
If you followed the guide this far, you should have landed on the scenario's Analyze page. To find this page again:
- Click on the
Scenario Managertab. - Locate your scenario in the table.
- To the right are multiple buttons, each corresponding to a page we have seen so far.
- Click on
Analyze.
On this Analyze page are multiple buttons. You can:
- Start or Stop the REVEN server for this scenario.
- Start Tetrane's analysis GUI named Axion.
- Open up the Jupyter interface for Python scripting.
NOTE: As the latter two options require a REVEN server, they will start it up automatically if it is not already running for this scenario.
The analysis GUI Axion
-
Click on
Start Axion. Note this will automatically start the scenario's REVEN server as well.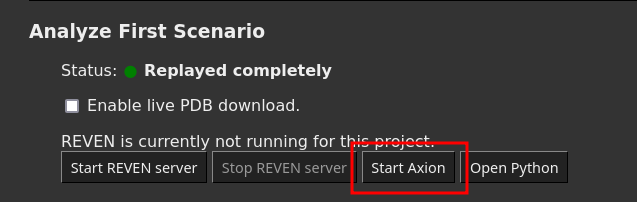
-
Click on
Show in browserto open the Analysis GUI.
The GUI opens up and various widgets show you the content of the trace. By default, the GUI points at the beginning of the trace, and since we started recording manually, you are probably looking at some system code.
Moreover, if this is the first time your start Axion, the GUI Tutorial has popped up. If not, start it manually:
-
Click on the
Tutorialbutton located on the toolbar.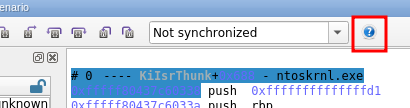
-
Follow the tutorial up to the end: you will learn about all widgets and the basics of trace navigation.
-
Close the tutorial.
Once this is done, there are a few things we can start looking at in our trace. Note there might be slight differences depending on whether the guest you recorded is a Windows or Linux VM.
Finding the entry point
We want to skip the system code and jump straight at the program's entry point.
- Start a
Symbol callsearch on the binaryhostnameand symbolwmain:- Start typing
hostnamein the binary path field. - Use the autocomplete to select the full binary path.
- Move to the symbol name field, start typing
main. - Select the proper entry point (
wmainon Windows) - Press Enter to start the search
- Go to the next result by pressing F4.
- Start typing
- Bring up the Calltree widget: you can now start exploring the binary's trace.
Linking the printed string to its source
NOTE: On Linux traces and especially at the beginning of a program, your are likely to see calls such as init+0x56 where you would expect libc calls: this is the library loader dynamically finding the destination the first time a call to a particular library function is made. This gets better when more and more calls are resolved.
-
Try to find the function call responsible for printing the hostname on the command line:
-
In the Calltree widget, unfold the calls made by the
mainfunction and children. You are looking for a function name containingputorprint. -
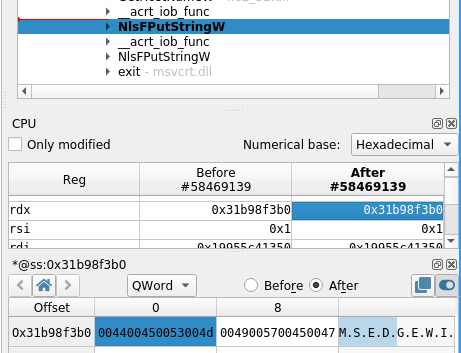
To check a candidate that could print what you want, double-click on it.
-
Look at the registers to see the call's arguments. You can double-click on a register value to open up a memory view at the register's address.
-
If you see the hostname in the memory view, you have find your output buffer.
-
-
Try to see where this buffer is coming from:
-
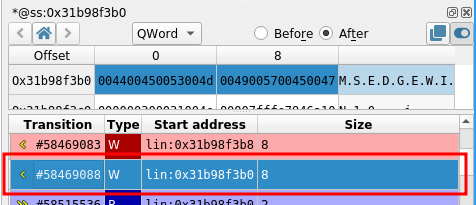
Open up the memory history on the output buffer but checking
Show access history of selection.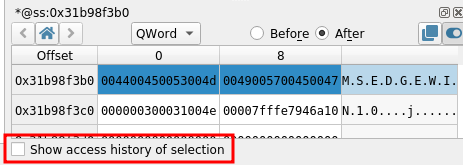
-
The closest access that occurred before the point in time we are at will be selected. Double-click on the closest Write access to see where this address was written to last.
-
Look at the current symbol, and the Calltree or the Backtrace: you traveled back to when the hostname was fetched.
-
Python API
We can also use the Python API to get information from a trace.
-
Go back to the scenario's
Analyzepage. -
Click on
Open Python -
Create a new notebook:
-
Click on
Newat the top-right corner. -
Select a
reven-2.x.xnotebook.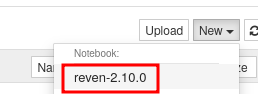
A new notebook has opened. You can type python code into cells and execute them.
-
-
Type in
print("hello")into the top-most cell and execute it by pressing Ctrl+Enter. -
Spawn a new cell with the
+toolbar button.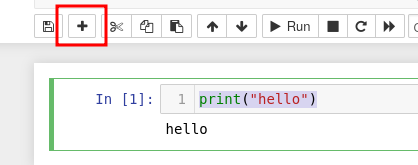
-
You are now ready to follow the Python Quick Start guide using this notebook.
What's next
This quick start guide is now over. At this point, there are multiple things you can do:
- Read more about Managing VMs, especially the Need to Know section for more details about certain steps we took during this guide.
- Use the registered VM to record new scenarios with your own binaries:
- Use the
Select files to make available on the VMstep to push new files - On the recording screen, click on
Insert Scenario CDROMto mount the CD-ROM on the guest.
- Use the
- Take a look at pre-recorded scenarios you can download, import into your REVEN installation and analyze.