Connecting WinDbg
REVEN integrates WinDbg at multiple stages of the workflow. See the parent page for more information.
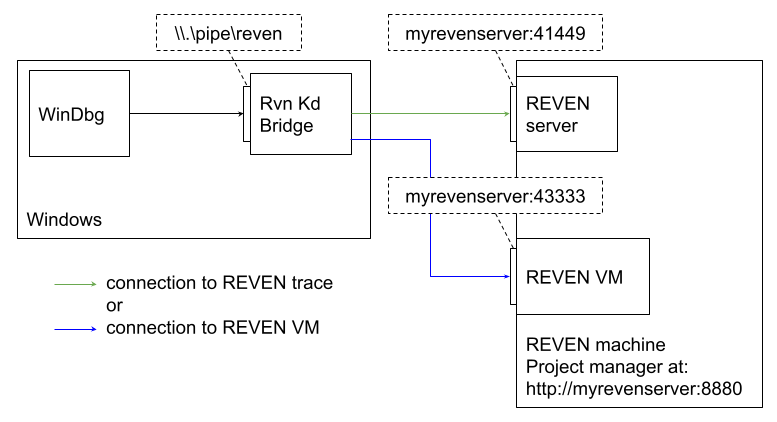
Debugger-assisted recording and trace analysis are two different use cases but both require connecting WinDbg in a similar manner. This page will describe how to set this connection up in both situations:
- Selecting the target and finding its port
- Debugger assisted recording: the target is a VM
- Trace analysis: the target is a trace
- Connecting the bridge to the target
- Connecting WinDbg to the bridge
Prerequisites
Installing RvnKdBridge
You can find RvnKdBridge in the DOWNLOADS section of the Project Manager. Extract it on the machine where WinDbg will run.
Network setup
The machine on which WinDbg will run must have network access to the REVEN server, not only on the Project Manager port but also to the target's port (see section below).
Starting the target and finding its port
RvnKdBridge will connect to a target identified by a port number. Which target to connect to depends on your use case.
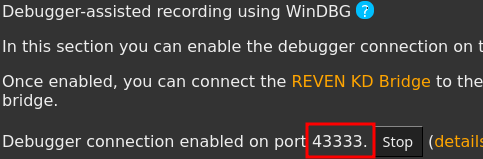
Debugger-assisted recording
When using WinDbg to help with the recording of a scenario, your target is the VM. You must use the VM debugger connection port number:
- Go to the "Record" page of the scenario you are about to record.
- If not already running, start the VM as usual.
- In the "Debugger-assisted recording" section, click on "Enable debugger connection".
- The target port appears below:
Note there are requirements on the target VM:
- The VM snapshot must be prepared
- The kernel must be mapped in memory at the time of connection. This is generally the case in a fully booted VM.
- All versions of Windows supported by REVEN are supported.
Note that it is not required to start the VM with /debug.
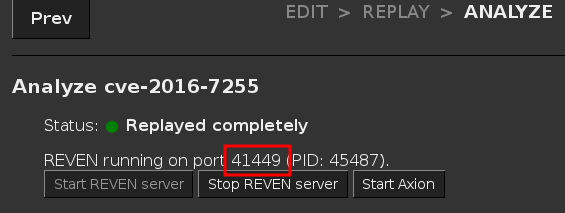
Trace analysis
When trying to analyze a trace with WinDbg, you must use the REVEN's port number you can find on the "Analyze" page of the scenario:
- Go to the "Analyze" page of the scenario you want to connect to
- If not already running, open the trace by clicking on "Start REVEN server"
- The REVEN trace port appears below:
Note there are requirements on the REVEN scenario:
- All OS Specific Information (OSSI) resources must be replayed.
- All versions of Windows supported by REVEN are supported.
Note that it is not required to start the VM with /debug when preparing it for recording.
Connecting the bridge to the target
Launch the program RvnKdBridge.exe. There are multiple fields to fill in.
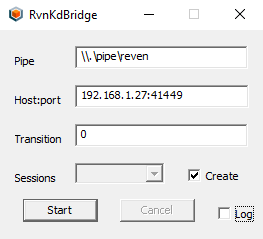
Pipe: Path of the named pipe to create. The format is\\.pipe\<mypipename>, for example\\.pipe\reven.Host:port: Description of the project's server & port. The format is<hostname>:<port>.- The host is the address of your server
- The port is the one you have determined in the previous step.
Transition:- If the target is a trace: at which transition in the trace the bridge will start. WinDbg will see the REVEN trace as a VM stopped at this point in time for debugging.
- If the target is a VM: this parameter is ignored, you should set it to 0.
Createcheckbox: Whether or not a new synchronization session for Axion should be created. Ignored if the target is a VM.
Connecting WinDbg to the bridge
The next step is to connect WinDbg to the named pipe you specified. The procedure differs slightly between WinDbg x64 and WinDbg Preview.
In WinDbg x64, follow the steps below:
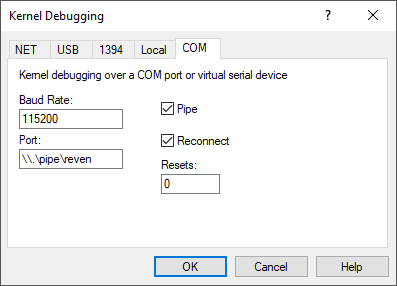
- Click on
File - then
Kernel Debug. - Select the
COMtab, - Check
Pipe. - In the
Porttext field, enter the name of the pipe. - Finally, click on
OK.
In WinDbg Preview, follow the steps below:
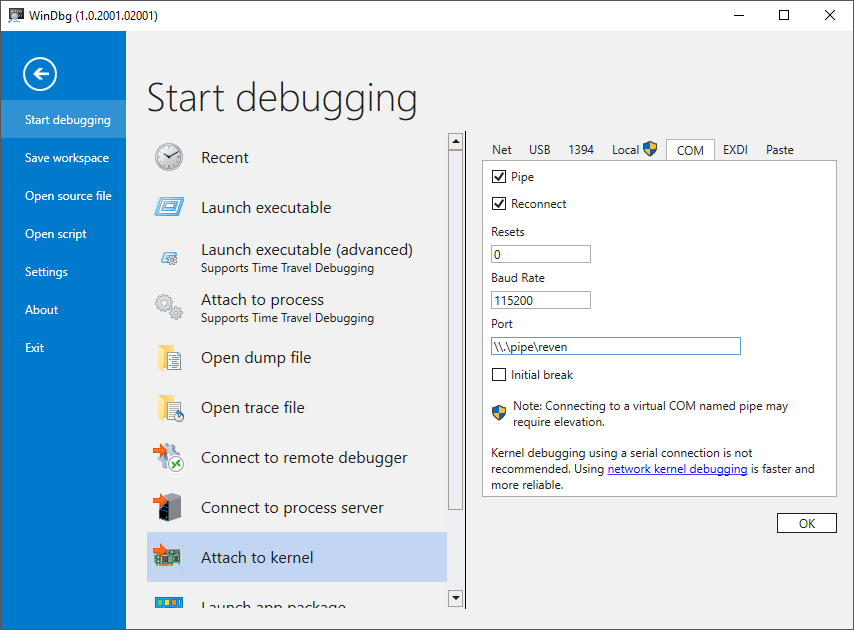
- Click on
File Start debugging- then
Attach to kernel. - Select the
COMtab, - Check
Pipe. - In the
Porttext field, enter the name of the pipe. - Finally, click on
OK.
Using WinDbg
In both use cases, WinDbg is connected in kernel mode. See the Usage page for specificities of using WinDbg in this context.