REVEN - User documentation
Welcome, this is the starting point of the user documentation of REVEN v2.
- What is REVEN?
- About Editions
- Installing your brand new REVEN:
- See the Installation section
- Then follow the Quick start guide!
- What's new in the latest release?
Basic Topics
- Managing VMs
- Recording and Replaying scenarios
- Analyzing scenarios
- Operating the server
Advanced Topics
- Automatic recording
- Using the Integration with WinDbg
- Using the Fuzzing & Triage Platform
- Misc. information
- Getting support
Quick links
What is REVEN?
Summary
REVEN is a Timeless Debugging and Analysis (TDnA) Platform designed to go x10 faster & x10 deeper while reverse engineering.
REVEN users use it for vulnerability analysis, malware analysis, software discovery, exploration of Windows or Linux kernel mechanisms, etc.
Technically, REVEN records the execution of an entire virtual machine for a duration of time, then provides access to that recording via both a GUI (named Axion) and an Python API to allow analysis.
The analyst can follow the trace of all executed CPU instructions for all processes and kernel modules, alongside memory and CPU registers.
Moreover, REVEN provides unique analysis features such as the Memory history or the Taint. Finally, REVEN provides high-level context with process names, binaries and symbols.
Get the job done
Here are a few examples representative of what can be achieved with REVEN:
- Analyze a Chrome CVE
- Detect Interprocess Use of Uninitialized Memory
- Find uses of cryptographic functions and the data encrypted
- Compare traces
- Trace network data back to encryption
- Automate recordings and analysis
- Record non-determinist crashes
Timeless analysis as a first-class citizen
REVEN and its collection of features provides a unique way to reason about the execution of a system and extract answers from a recorded trace:
- Explore the recorded trace timelessly and intuitively with the Trace View, the Search, or the Call tree.
- Stay at the level of a process or dive deep into kernel and driver code if necessary.
- Follow the data flow between functions, binaries or processes with the Memory History and the Taint engine and get immediate answers.
- Automate repetitive actions or build complex heuristics with the Python API.
See the Axion Views for more screenshots of the various provided features.
Batteries included
A lot of effort went into making REVEN a comprehensive and easy-to-use tool in your toolbox:
- Import Virtual Machines and record scenarios easily with the step-by-step GUI.
- Access the whole scenario's data and discover features with the Analysis GUI.
- See debug symbols thanks to automatic PDBs download and support for linux debug files.
- Combine REVEN with other tools thanks to the built-in integration with third-parties: WinDbg, IDA / Ghidra / Binary Ninja, Wireshark...
- Get direct support from the development team as part of your license, to sort out questions or issues quickly.
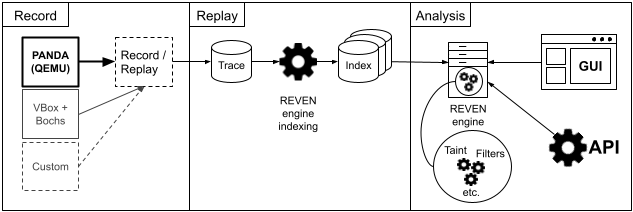
How does it work?
REVEN is built as mutiple moving parts:
- A Recorder & Replayer, to record the Virtual Machine & replay its execution later on. REVEN can plug on multiple recorders (and you can build your own), by default REVEN integrates with and recommends using QEMU-based PANDA.
- An analysis engine, that builds indexes and provides the high level features of trace navigation, tainting, filtering, etc.
- Multiple GUIs and Python APIs to glue this all together and provide a seamless experience.
I want to learn more
Here is a list of further resources should you want to know more about the product:
About Editions
REVEN comes in several editions:
- Enteprise Edition: Timeless Analysis for teams and automation
- Professional Edition: Timeless Analysis for professional Reverse Engineers
- Free Edition: Free Timeless Analysis for hobbyists, students and evaluation
Which edition to choose depends on the kind of license, and the level of features and support you require.
See the pricing page for more information.
About REVEN Enterprise Edition
REVEN Enterprise Edition is a paid REVEN edition that you can use with floating licenses without an Internet connection. It is designed for teams and automation by leveraging the REVEN Workflow API.
Compared with the Professional Edition, the Enterprise Edition presents the following advantages:
- Floating license that can be used on an air-gapped network.
- Parallel workflows allowed.
- Full access to the Workflow API, that allows to programmatically record/replay scenarios and start analyses.
- Full access to the binary/ASM stub autorecord features.
For more details about the characteristics of the Enterprise Edition, please refer to the edition page on the website.
Getting started
Please refer to the standard documentation's Installation section for getting started.
About REVEN Professional Edition
REVEN Professional Edition is a paid REVEN edition that you can use with an active Internet connection as a named individual. It is aimed at professional Reverse Engineers that use REVEN to augment their RE practice.
Compared with the Free Edition, the Professional Edition presents the following advantages:
- Support of recent Windows versions, including Windows 10, and more recent Linux kernels (up to 4.18) as targets for recording/replaying/analyzing scenarios.
- Ability to record/replay/analyze unsupported target OSes (the OSSI and other features might not be available on unsupported targets).
- A regular release schedule with new features, improvements and bugfixes.
- Direct support through the support@tetrane.com email address.
Compared to the Enterprise Edition, the Professional Edition has the following differences:
- Named license that is checked online and requires an active Internet connection.
- Restricted to a single parallel workflow: 1 record & 1 replay allowed in parallel, 1 analysis allowed in parallel.
- No Workflow API, that allows to programmatically record/replay scenarios and start analyses.
- No access to the binary/ASM stub autorecord features.
For more details about the characteristics of the Professional Edition, please refer to the edition page on the website.
Getting started
Please refer to the standard documentation's Installation section for getting started.
About REVEN Free Edition
REVEN Free Edition is a REVEN edition that you can use for free. It is aimed at hobbyists, students, or professionals who would like to test REVEN before opting for a paid edition.
It presents the following differences with the REVEN Professional Edition:
- It is only possible to replay/record scenarios using one of the following environments:
- Windows 7 (32 or 64-bit).
- The provided Debian 9 Stretch Virtual Machine (VM). The paid editions provide support for analyses of Windows 10, Windows 11, and Linux up to kernel version 4.19. Furthermore, it is possible to record any OS on any x64 VM (although OS Specific Information might be missing).
- It is necessary to perform the "Prepare" step for all VMs and to replay the OS Specific Information (OSSI) to record/replay a scenario.
- It is only possible to import scenarios that were recorded in an environment supported by the Free Edition.
- The Free Edition will follow its own schedule of updates: it may not benefit from the features, bugfixes and other improvements of the paid editions on the same time frame.
For more details about the characteristics of the Free Edition, please refer to the edition page on the website.
Software download
You can download REVEN Free Edition from the dedicated page. Choose the docker package if installing on any Linux 64-bit, or the native package if installing on a Debian 10 Buster 64-bit.
License setup
REVEN Free Edition requires a free, 3-month license that can be renewed. There is no upper limit to the number of successive free licenses you can generate. We'd be glad to hear back from you during the renew process. Feel free to provide a rating and comments on that occasion.
After installing the REVEN server, you will need to install a free license on the first use of the Project Manager.
Point your favorite web browser to the Project Manager's homepage: http://localhost:8880 by default. The welcome screen will ask you to generate a license.
Generating a free license can be done:
- From REVEN's Project Manager if connected to the Internet.
- From another Internet-enabled device, using the URL provided by the Project Manager.
Analyzing your first scenario
Windows
Follow the Quick start guide for Windows 7.
Linux
Download the provided Debian 9 Stretch VM, then follow the Quick start guide for Linux.
Internet Connectivity
REVEN Free Edition can be used on an air-gapped machine. When an active Internet connection is available:
- You can import Virtual Machines from the Internet directly in the Project Manager.
- REVEN can download PDB files from the Internet.
- REVEN Free Edition performs online license checks from time to time. License checks only include your license key.
Software support
Email-based support is reserved to paid editions; Free Edition users are invited to consult the Support page for more information on how to get support.
REVEN installation instructions
This section will guide you through the process of installing REVEN for the first time.
By the end of this section, you will have a running REVEN server with its license setup and will be able to proceed to the quick start guide.
To upgrade REVEN to a newer version, please read the "Upgrading REVEN" section in the release notes.
Getting the packages
You can find the download links for the available REVEN packages in the message you received containing your REVEN license information. Choose the package depending on whether you wish to install on any Linux distribution through the Docker image or natively on Debian Buster.
These links always points to the latest released version of REVEN, so you can reuse them when upgrading.
Choosing which package to install
If you wish to install REVEN on an existing Linux distribution, we recommend you choose the Docker package to do so.
If you are installing a fresh Linux distribution dedicated to REVEN on your hardware, we recommend to install Debian Buster and use the native REVEN package that has more configuration options and supports VirtualBox VMs.
Installation steps
REVEN consists of a server and of several clients. The server provides the Record/Replay features, and exposes the Project Manager, a web interface to manage projects. The clients (Axion GUI, Python API) connect to the server and uses its analysis feature to allow for manual or automatic analysis.
Please follow the steps below to install REVEN:
- Before installing, please review the pre-requisites.
- Installing the server part of the software is mandatory.
- After the server installation, it is mandatory to install a license to finalize the setup.
- You can now access your REVEN installation entirely from the web interface.
Optionally, the client part can be installed locally.
Open source software license information
REVEN implements programs governed by a free or open source license. The corresponding list of programs, their license(s) and source code are available at https://github.com/tetrane/tetrane-oss. These programs come with ABSOLUTELY NO WARRANTY; before using, modifying or distributing them, please make sure to read their license and accept the attached terms and conditions; you are welcome to redistribute free or open source software under certain conditions.
Pre-requisites
This page lists the minimum pre-requisites to meet for a new REVEN installation of the server. When in doubt, don't hesitate to contact us.
Hardware
- A desktop processor is good enough in a large number of cases.
- The minimum RAM amount is 16GB.
- REVEN is highly I/O performance dependent, and requires at least a SATA SSD.
- The storage capacity for that SSD should be at least 1TB.
- In the Professional Edition, an active Internet access is required while using REVEN.
System
- The docker package supports any Linux distribution.
- The native package must be installed on a Debian 10 Buster amd64 system.
- Full network access to the server.
For installing REVEN in a virtual machine
- Nested virtualization must be supported in the host machine and enabled for the REVEN VM. Please see the dedicated section on how to do this if you are unsure.
- The virtual disks should be configured to provide maximum performance. The default parameters may be enough, but as this heavily depends on your setup, this documentation cannot provide more detailed installation steps. If you encounter performance problems with REVEN later, this requirement may be a cause. Don't hesitate to contact support for guidance in your particular case.
- All other hardware and system requirements must be met for REVEN to run smoothly.
Both the native REVEN package and the docker package can be installed in a VM. If starting from scratch, you can for instance install Debian Buster in a fresh VM, and then the native package in that VM. If you already have other Linux VMs that are not Debian Buster, then you can install the Docker package.
Once you reviewed the pre-requisites and made sure to meet the baseline, you can proceed further to the Server installation.
Advanced pre-requisites
- Advanced Hardware pre-requisites
- Advanced System pre-requisites
- Dedicated Virtual Machines pre-requisites
Advanced hardware pre-requisites
This page details the hardware pre-requisites for the server. In most installations, reading the basic pre-requisites should be sufficient.
NOTE: Installing the REVEN server on a virtual machine is also supported. Please check the special requirements here.
Processor
The main CPU bottleneck, when using REVEN with a high performance storage solution, is the replay step, which is using around 4 cores and is highly dependent on single core performance (high frequency and/or high IPC) of the CPU.
In the Professional Edition, you can replay only one scenario at a time. So REVEN will use a maximum of 4 cores for the replay, 2 others for scenario analysis and 2 others cores for the Project Manager.
In the Enterprise Edition, you can replay and analyze an unlimited number of scenarios at a time, so determining how many cores are needed will depend on your usage of REVEN.
Our recommendation is to choose a high-frequency Intel or AMD processor(*) with at least 8 cores. Besides, the most recent processor, the most performance you will get out of it. So, last-gen processors are the best choice. On lower-performance processor, REVEN can still be used but will be slower.
A desktop processor is good enough in a large number of cases. Server processors tend to have a higher number of cores but reduced single core performance. They may be preferred when your workload consists of several concurrent replay tasks or scenario analysis sessions. Mobile processors can be used although they often exhibit lower performance than desktop processors.
(*): Currently, AMD processors can only be used to record QEMU virtual machines, not VirtualBox virtual machines. Learn more about VBox recording here. Unless you have specific recording requirements, we generally recommend using QEMU virtual machines.
Memory
In terms of capacity, in the Professional Edition, the minimum is 16GB but we recommend to have at least 32GB. For the Enterprise Edition, it also depends on your usage (number of simultaneous replays and running REVEN servers).
NOTE: To avoid curbing your high-end processor, having fast enough RAM (frequency + timing) is necessary.
Storage
REVEN is highly I/O performance dependent, and requires at least a SATA SSD, but we recommend having a NVME SSD or better. Note that any type of RAID-0 configuration may help reduce the disk I/O bottleneck. For example if you have a really high-end processor and/or if you will replay multiple scenarios at a time.
As scenarios/VMs can require up to hundreds of GB on disk, the minimum capacity of your storage should be 1TB. We recommend 2TB or more to work on more unarchived scenario in parallel and reduce import/export operations.
We also recommend having extra HDD storage to archive unused scenarios.
Internet access
In the Professional Edition, an active Internet access to https://api.keygen.sh and https://dist.keygen.sh is required while using REVEN.
For both editions, an active Internet access is recommended for downloading symbol information, unless you are using an offline PDB server (see also Using PDBs on air-gapped networks for more information about this use case).
Advanced system pre-requisites
This page details the system pre-requisites for the server. In most installations, reading the basic pre-requisites should be sufficient.
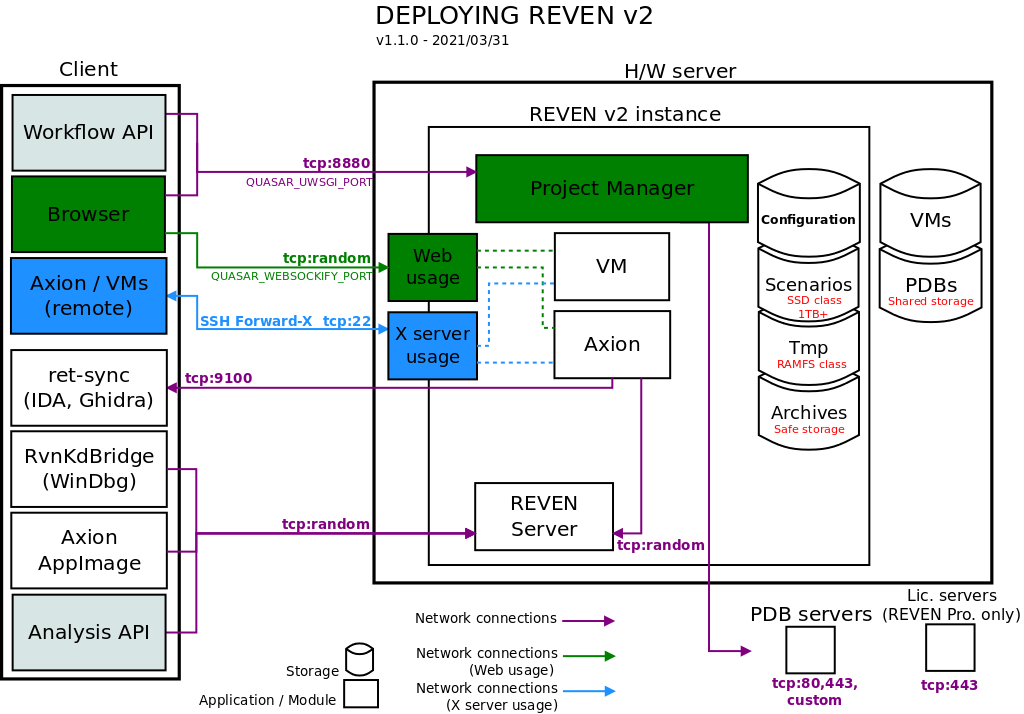
Deployment overview
The following diagram gives an overview of the deployment of REVEN.
Operating system
- The docker package supports any Linux distribution.
- The native package must be installed on a Debian 10 Buster amd64 system.
Storage
The table below shows how REVEN organizes its data.
| Path | Comment |
|---|---|
| VM | The VM repository containing the QEMU images, should be fast for snapshot save/load operations. |
| REVEN scenarios | VM-specific files such as their filesystems, the REVEN recordings, the replay files, which may be quite large (hundreds of GB). Storage requires a high I/O throughput, to get the best performance out of REVEN (e.g. SSD). Since this directory will contain SQlite databases, be careful not to have it being in an NFS mount, or you may experience some difficulties and bugs. |
| PDBs | Can be shared between users and/or machines. |
| Archives | The scenarios exports. Can be used for backups. Storage can be slow, should be safe (RAID, ZFS, ...). |
| Temporary directory | A work directory for REVEN. The faster the better. Putting that directory in a RAMFS mount point will even help reduce latency during scenario recording. |
The table below shows the configuration variables that can be set during the installation process to change the corresponding path.
- For the Docker package, the variables can be edited in the
run.shat the root of the package. - For the native package, the variables can be edited in the
settings.pyfile at the root of the package, or in the user-wide setting file (defaults to~/.config/tetrane/quasar.py).
| Path | Docker package run.sh | Native package settings.py/quasar.py |
|---|---|---|
| VM | VM_PATH | QUASAR_QEMU_SCAN_PATH |
| REVEN scenarios | REVEN2_PATH | QUASAR_ROOT |
| PDBs | SYMBOL_PATH | QUASAR_SYMBOL_STORE |
| Archives | Not configurable: $REVEN2_PATH/Archives | QUASAR_ARCHIVES_PATH |
| Temporary directory | Not configurable: $REVEN2_PATH/tmp | QUASAR_TMP |
Networking
The list below shows networking requirements and options between the REVEN server and other machines. Make sure any filtering device is configured to allow these connections.
-
Main Project Manager interface:
QUASAR_UWSGI_PORTBy default, the Project Manager listens on port 8880. -
VMs and Axion Web usage:
QUASAR_USE_VNC=TrueBy default, VMs and Axion displays are served through a random port. The settings variableQUASAR_WEBSOCKIFY_PORTallows to set a fixed value for this port. -
VMs and Axion X server usage:
QUASAR_USE_VNC=FalseFor this usage, you must be able to run X server applications in the terminal where REVEN is started: remote X or native X server will both work. A common situation is to use SSH X forwarding, in which case the SSH port must be open. -
REVEN server ports for Axion, Python API, WinDbg bridge: REVEN server listens on any port of the ephemeral port range, which defaults to [32768, 60999] on Debian. You may want to access these ports when using Axion, the REVEN Python API or the WinDbg bridge from a remote client. In which cases a VPN may prove useful.
NOTE: Implementing a reverse-proxy in front of REVEN may simplify the requirements on network filtering. Please refer to the specific reverse-proxy section.
-
Connections to the symbol servers:
QUASAR_SYMBOL_SERVERSAny symbol server listed in the symbol server list must be accessible to the Project Manager and the REVEN server. -
Connection to ret-sync (IDA/Ghidra): IDA/Ghidra synchronization with a REVEN trace requires Axion to connect to the machine running IDA/Ghidra (port 9100 by default). Here again, a VPN may prove useful.
NOTE: When the installation is on a machine using a proxy to access the network you should set QUASAR_HTTP_PROXY and QUASAR_HTTPS_PROXY so that the symbol servers and, in the case of the professional edition, the license server, are accessible. Please refer to the settings file for more information and examples about how to fill out these variables.
Advanced Virtual Machines pre-requisites
This page details the particular case of install the REVEN server in a virtual machine (VM).
Most common hypervisors were tested. That includes QEMU/KVM (e.g. Proxmox, virt-manager, ...), VMware ESXi, VMware Workstation, Microsoft Hyper-V, but others should work too.
Tips and tricks
Here are some quick guidelines that should help you get in the right direction. In any case, please refer to the official documentation for your hypervisor or your system administrator to get the most accurate guidance.
QEMU/KVM
The status of nested virtualization on Linux can be checked with the following files:
/sys/module/kvm_intel/parameters/nestedfor Intel CPUs./sys/module/kvm_amd/parameters/nestedfor AMD CPUs.
For example:
$ cat /sys/module/kvm_intel/parameters/nested
Y
If nested virtualization is disabled, you can enable it by running the following as root:
- For Intel CPUs:
# echo 'options kvm_intel nested=1' > /etc/modprobe.d/kvm.conf - For AMD CPUs:
# echo 'options kvm_amd nested=1' > /etc/modprobe.d/kvm.conf
The modification will be effective after the next reboot.
VMware ESXi
Nested virtualization on ESXi can be enabled by running the following command as root:
echo 'vhv.allow = "TRUE"' >> /etc/vmware/config
The nested virtualization option must then be further enabled on a per-guest basis. The option to look for is called Hardware virtualization: Expose hardware assisted virtualization to the guest OS.
VMware Workstation
The nested virtualization setting on Workstation is set on a per-VM basis. Look for the Virtualize Intel VT-x/EPT or AMD-V/RVI option in the VM Settings.
Microsoft Hyper-V
The nested virtualization setting on Hyper-V is set on a per-VM basis. It is activated by running the following in a Powershell console:
Set-VMProcessor -VMName <VMName> -ExposeVirtualizationExtensions $true
Troubleshooting
start.sh refuses to launch REVEN with a /dev/kvm problem
If you encounter the following error when running start.sh to launch REVEN:
ERROR: '/dev/kvm' does not have read/write permissions with this user.
This may be due to the nested virtualization being ill-configured. You can check that easily with kvm-ok directly in
the virtual machine:
sudo apt install cpu-checkersudo kvm-ok
If the last command returned an error, then you should check that the VM does have nested virtualization enabled.
Issue during 'Prepare VM'
If during a Prepare VM task, you happen to have libguestfs complaining with the following error:
kvm_put_msrs: Assertion 'ret == cpu->kvm_msr_buf->nmsrs' failed.
Try running the following as root on the guest VM you installed REVEN on:
echo Y > /sys/module/kvm/parameters/ignore_msrs
If this works, you can make it permanent after next reboot:
echo 'options kvm ignore_msrs=Y' > /etc/modprobe.d/kvm_ignore_msrs.conf
REVEN server installation instructions
The REVEN server can be installed on several platforms depending on your configuration:
- Installing through a VM disk package on a hypervisor.
- Installing through the Docker image on any Linux distribution.
- Installing through the native package on Debian Buster.
Not sure about which package to install? Please refer to our documentation on how to choose a package.
Once the server installation is done and the server is up and running, finalize the installation by installing your REVEN license.
REVEN Docker installation instructions
The Docker package allows you to install and run REVEN on any Linux distribution, while the system prerequisite to install the default REVEN package is Debian 10 "Buster" release.
Configuration
Before starting the Docker package, you can optionally change some of its configuration.
Changing the default paths for VMs and other resources
In the run.sh script contained in the Docker package, you can modify the following variables to change the paths to various resources if you need them to point to specific locations:
VM_PATH=~/VMs: the directory where the registered QEMU Virtual Machines (VMs) are stored. It is advised to set this path to a big enough storage location.REVEN2_PATH=~/Reven2: the directory where most of REVEN data is stored:- The record and replay data of scenarios.
- The extracted filesystem.
- The exported scenario archives. Due to this directory containing the replay data of scenarios, it is advised to set its path to a fast and plentiful storage location.
CONFIG_PATH=~/.config/tetrane: the directory where the user-wide settings are stored. These are typically small and not performance sensitive.SYMBOL_PATH=~/.local/share/reven/symbols: the directory where the debug symbol files recovered from symbol servers are stored. It is advised to set this path to a big enough storage location.
The default locations should be fine in a typical setup.
Starting the server
Launch the run.sh script at the root of the Docker package and then follow the instructions from the script.
Once the container started, you can reach the REVEN Project Manager by opening its URL (defaults to http://<your_reven_host>:8880), and you can then finalize the installation by installing your REVEN license.
Advanced Docker Installation
Changing the port on which the web interface listens
Changing the ports on which the web interface listens is generally not required, as the default ports will work if available. However, should the default ports already be in used by some other applications, this section will guide you through the process of changing the port numbers.
Because the docker runs with its own internal network interface, you must consider two sets of addresses and port:
- The internal address and ports of the docker, that you'll never need to change. It is what is displayed by
./run.shwhen starting the conatiner, e.g.http://172.17.0.2:8880. - The address and ports of the docker bound to the host, that use the host's network and is potentially accessible from other machines, e.g.
http://127.0.0.1:8880. This is the set of ports we are interested in changing.
- In the
run.shscript contained in the Docker package, find theif ! $SUDO $DOCKER runcommand that spans multiple lines, then look for the lines-p 8880:8880that binds UWSGI's port (Project Manager) to the host,-p 8881:8881that binds Jupyter's port (Python notebooks) to the host, and-p 6080:6080that binds websockify's port to the host.
For each of these lines, change the first value to the port you want to connect to.
For example, to have the Project Manager listen on port 2000, change the first line to read: -p 2000:8880.
To have the Jupyter interface listen on port 2001, change the second line to read: -p 2001:8881.
To have the websockify bound to port 2002, change the third line to read: -p 2002:6080.
- If you changed Jupyter's port, you also need to define the
QUASAR_JUPYTER_PUBLIC_PORTvariable in~/.config/tetrane/quasar.pyto the same value, e.g.QUASAR_JUPYTER_PUBLIC_PORT=2001. - If you changed websockify's port, you also need to define the
QUASAR_WEBSOCKIFY_PUBLIC_PORTvariable in~/.config/tetrane/quasar.pyto the same value, e.g.QUASAR_WEBSOCKIFY_PUBLIC_PORT=2002. - Note that even if you changed UWSGI's port (Project Manager), you do not need to change any variable in the user-wide configuration.
NOTE: Even when changing the port on which the web interface listens, the address and port displayed when running ./run.sh will remain the internal address and port of the docker, e.g. http://172.17.0.2:8880. For connecting to the web interface after changing the ports, you need to use the address and port of the docker that are bound to the host, e.g. http://127.0.0.1:2000.
Docker vs Podman
Docker is a well-known container technology. Podman is a more recent one, less spread, that aims at fixing some of Docker's caveats like its daemon that runs as root.
Our REVEN image is built with Docker, but has been tested already with Podman,
and both have been observed to work, but it strongly depends on the distribution
you are using, the Linux kernel version, each technology's version, and the
overall environment, like kernel boot command line, configuration in
/etc/subuid and /etc/subgid, your user ID, or the filesystem you are using
(ext4, btrfs...)
In a nutshell, if you have an already working Docker daemon, this one should
work fine. If you don't and/or want to use Podman with a rootless container, it
has been known to work fine on Fedora 31 and CentOS 8.1.1911, but had problems
on OpenSUSE Tumbleweed snapshot 20200326, and an up-to-date Manjaro as of
2020-04-07. Just update the DOCKER variable in the run.sh script to make the
switch to podman.
About Axion using your host's X server instead of VNC
It is possible to have the container use your host's X server to spawn Axion. But as this heavily depends on the host's configuration, it cannot be enabled by default. To do that, the steps are basically the following:
- Run the container:
./run.sh - Get your container's name:
docker ps | grep tetrane - Disable the use of VNC in the settings of the container:
docker exec <container-name> sed -i '/QUASAR_USE_VNC/cQUASAR_USE_VNC = False' /reven/settings.py - Commit your running container to a new image:
docker commit <container-name> tetrane/reven2:2.4.0-withX - Stop your running container:
./run.sh - Edit the
run.shscript:- Update the
REVEN_VERSIONvariable to match your new image's name: e.g.REVEN_VERSION="2.4.0-withX" - Find the part of the script that runs the container to give it your
host's X server. This boils down to adding the following options to
to the
$DOCKER runcommand:-v /tmp/.X11-unix:/tmp/.X11-unix-e DISPLAY="$DISPLAY"
- Update the
- Run the container again:
./run.sh. Axion should now open as a native X window in your desktop environment. If it does not and instead logs an error like "could not connect to display", you may have to play with X permissions, running something likexhost +, but which would allow only what's good for your setup.
About VirtualBox
VirtualBox is currently not supported by the REVEN container installation. Please perform a regular REVEN installation to use this feature.
Personalizing the REVEN image efficiently
Some networks, or company policies, may require you to customize the REVEN
Docker image. A common use-case is adding a CA root certificate to access local
services, such as a PDB server.
In order to industrialize these customizations upon each upgrade of REVEN, an
elegant solution is to leverage the docker build command, with a Dockerfile,
to add your own layer of customization on top of the REVEN image.
The full documentation of this is here: https://docs.docker.com/engine/reference/builder/
Here is a concrete example of a procedure to add a custom certificate so that REVEN can connect to an internal PDB server. You can adapt it to your own customization needs:
- Go to your REVEN Docker package folder:
cd path/to/reven/package - Start your REVEN container at least once with the stock image:
./run.shThis ensures that the stock image will be loaded into your Docker installation. You can verify this by runningdocker images:$ docker images REPOSITORY TAG IMAGE ID CREATED SIZE tetrane/reven2 2.7.1-enterprise 954572ebb0a1 2 months ago 3.4GB - Stop the running container:
./run.sh - Create a working directory and get into it:
mkdir ~/reven_docker && cd ~/reven_docker - Copy your custom certificate to this directory:
cp path/to/cert.crt . - Create a new
Dockerfilefile with the following content:FROM tetrane/reven2:2.8.0-enterprise ADD cert.crt /tmp/cert.crt RUN cat /tmp/cert.crt >> /reven/share/reven/quasar/venv/lib/python3.7/site-packages/certifi/cacert.pem - Build your new image:
docker build -t tetrane/reven2:2.8.0-enterprise-with-ca . - Go to your REVEN Docker package folder:
cd path/to/reven/package - Change the
REVEN_VERSIONvariable in therun.shscript with the new image version you just built:2.8.0-enterprise-with-ca - Enjoy your new container with the patched REVEN image:
./run.sh
In the future, to upgrade the patched REVEN image with e.g. REVEN 2.9.0, simply repeat the above steps with the new REVEN package and image name.
REVEN Debian installation instructions
Follow the steps below to install REVEN. They must be performed with a regular, non-root user account.
Installing the package
-
Unwrap the REVEN package. You can choose to install it anywhere you want on your file system. Change your current directory to the root of the unwrapped package.
-
Install the required system dependencies:
./install.shThis will ask for yoursudopassword in order to install the system dependencies.NOTE: For information and documentation about
sudo, please find the Debian documentation here.NOTE: If you have a separate privileged account, then it's not a problem to run
install.shwith this account, since the install process does not depend on any particular user-specific variable. -
Add your user to the group
kvm:sudo adduser your_user kvm -
Install the REVEN environment:
./start.sh
Configuring the package
You can change settings at the user-level or per REVEN installation.
User-wide settings
Some Project Manager settings can be changed at the user level, for
all the versions installed for this user, in the file ~/.config/tetrane/quasar.py.
This file can store settings common to all the user's versions of the Project
Manager, such as the list of symbol servers or some storage paths. It is created
the first time a Project Manager is started for the user.
Per-instance settings
Some Project Manager settings can be changed at the instance level, at
the root of the installation directory, in the file settings.py. It is created
the first time an instance is started.
IMPORTANT: Remember to run stop.sh then start.sh for every running
version of the Project Manager in order to take new settings into account.
Finalizing the installation
After running start.sh successfully, you can reach the REVEN Project Manager by opening its URL (defaults to http://<your_reven_host>:8880), and you can then finalize the installation by installing your REVEN license.
Installing REVEN inside a VM
This section provides guidelines to install REVEN in a virtual machine.
Tetrane provides disk images in various formats, in order to support multiple hypervisors and configurations. Tetrane does not provide directly importable VM files, so you will need to setup a VM in your hypervisor to use this disk.
This page describes the common principles and steps for the installation or the upgrade of a REVEN version. Subsections will provide hypervisor-specific step-by-step instructions.
The latter subsections may not be exhaustive - please inform Tetrane if you think some specific hypervisor or version should be documented here.
Requirements
- The REVEN VM must be able to run VMs itself. Nested virtualization must be supported by the hypervisor and the host CPU.
- REVEN's requirements apply on the guest VM, with the caveat that REVEN's data must be stored on a dedicated VM disk, whose image itself is stored on a fast drive as required.
Installation
VM Creation
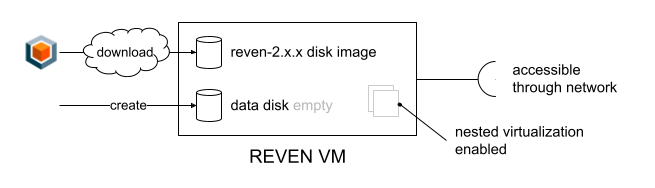
In order to install REVEN in a VM, you must:
- Download the REVEN VM installation disk (links in the purchase email).
- Create your VM accordingly (see below for the step-by-step instructions per hypervisor). This will include:
- Creating a new VM in your hypervisor and attaching the downloaded REVEN disk,
- Creating and attaching a second disk image for actual storage of REVEN's data,
- IMPORTANT: see the disk requirements - this storage disk file must be stored on a fast, flash-type disk.
- Activating the nested virtualization which is usually off by default,
- Configuring the network so that the host can access the VM's network services.
Note that regardless of your specific configuration, the VM must detect the disks as follows:
- REVEN's disk image must be found at
/dev/sda - The created data storage disk must be found at
/dev/sdb
Here are more detailed instructions for various hypervisors:
- VMware Workstation.
- Microsoft Hyper-V.
- QEMU-based hypervisors for QEMU, virt-manager and Proxmox.
Follow the instructions from one of these pages, then proceed to the next step.
First boot
Once your VM is properly configured, you can boot it up for the first time. The REVEN disk image will:
- Initiate a setup wizard for various items such as the keyboard,
- Properly detect the storage disk,
- Initialize the REVEN installation.
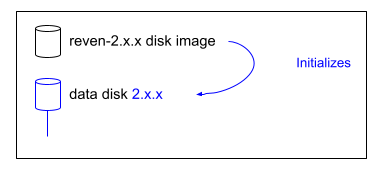
IMPORTANT: Note that once initialization is complete, the data storage disk has also been initialized and cannot be replaced with a new empty disk.
Moreover, any time you start the VM, it will check the configuration meets REVEN's requirements on CPU count and RAM size.
If everything was configured properly, you will see the VM's welcome screen:
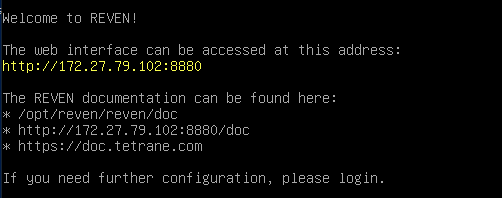
Your REVEN VM is now properly configured, you can finalize the installation by installing your REVEN license.
Usage specificities of REVEN in a VM
Connection
You can use REVEN by pointing a browser to the URL shown in the VM's welcome screen.
Storage disk growth
Throughout your usage of REVEN, the storage disk will grow in size:
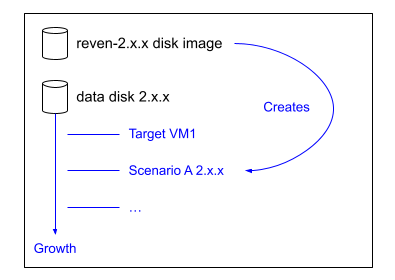
If this disk ends up too small for your usage (and you cannot clean up past projects), you can expand it:
- Properly shut the REVEN VM down (ACPI shutdown in your hypervisor).
- Using your hypervisor's tools or setting pages, grow the storage disk file.
- Boot the VM back up: it will automatically detect that the underlying disk has grown and resize the filesystem to accomodate the available space.
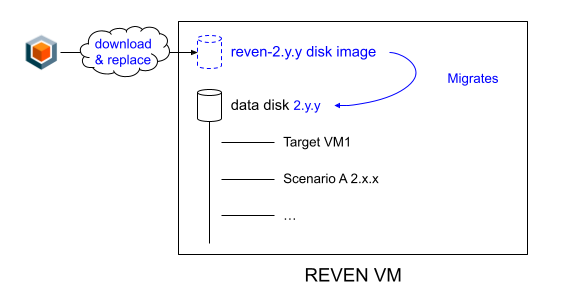
Upgrading REVEN
When a new version of REVEN comes out, you can simply upgrade your VM following the procedure below. Note that custom changes made to the system of your REVEN VM will have to be made again after the upgrade (installation of VM tools for example, installation of utilities, etc.) as the disk containing the OS will be replaced.
- Download the new REVEN disk image corresponding to your hypervisor.
- Properly shut the REVEN VM down (ACPI shutdown in your hypervisor).
- Using your hypervisor's setting pages, replace the REVEN disk image with the newly downloaded one.
- Make sure the new disk image takes the exact same spot hardware-wise, so that it is still detected as
/dev/sda - Keep the existing storage disk as is.
- Make sure the new disk image takes the exact same spot hardware-wise, so that it is still detected as
- Boot the VM back up:
- It will take you through the setup wizard again.
- It will detect the existing installation in the storage disk & upgrade it to the new version.
- Note that, if necessary, you will still have to migrate each scenario to the newer version via REVEN's Project Manager as with any other installation.
REVEN in VMware Workstation
Here are the specific steps to import the pre-installed REVEN's vmdk disk on VMware Workstation.
Before proceeding to the following steps, please make sure you read the general steps to install REVEN in a VM first.
Creating and configuring the VM
- Enter the
New Virtual Machine Wizardand pick the Custom (advanced) configuration mode (vs Standard). - Choose the
VM Hardware Compatibilityaccording to your needs. - In the
Guest Operating System Installation, pick theInstall Lateroption. - Select Linux OS with kernel 4.x or later 64-bit.
- Provide a name for the VM.
- Select a number of processors and cores per processor, so that the total number of cores is at least 8 (eg. 2 processors with 4 cores).
- Select the networking mode according to your needs.
- Wizard-recommended I/O controllers should be ok: SCSI, LSI Logic.
- Virtual disk type: SCSI.
- Select to use an existing virtual disk to reuse the REVEN disk.
- Select the REVEN vmdk disk. VMware may propose a conversion step.
- Configure the VM RAM capacity: see REVEN's requirements.
- Once the Wizard is complete, go to the VM settings
- The REVEN VM must be able to run VMs itself. The nested virtualization setting on Workstation
is set on a per-VM basis. In the Hardware/Processor VM settings, activate the
Virtualize Intel VT-x/EPTorAMD-V/RVIoption. - Configure the REVEN storage disk.
- In the hardware tab, configure a new Hard Disk, SCSI, New Disk.
- See REVEN's requirements to set the disk capacity.
- The Virtual Device node should be SCSI 0:1 (or if you make other controller / device choices, it
must map to
/dev/sdbin the system).
- The REVEN VM must be able to run VMs itself. The nested virtualization setting on Workstation
is set on a per-VM basis. In the Hardware/Processor VM settings, activate the
Booting it up
Your REVEN VM is now properly configured, you can go back to the general steps for install REVEN in a VM to boot it up.
Optional further steps
Data exchange
In order to exchange data between the host and the REVEN guest, one option is to setup a VMware Host Disk share:
- Configure the disk share in the Options tab of the VM settings.
- In the REVEN VM:
- Install the
open-vm-toolspackage:sudo apt-get install open-vm-tools - Mount the Host disk share, for example:
mkdir /home/reven/mnt
/usr/bin/vmhgfs-fuse .host:/ /home/reven/mnt
- Install the
REVEN in Hyper-V
Here are the specific steps to import the pre-installed REVEN's Hyper-V VHDX disk.
Before proceeding to the following steps, please make sure you read the general steps for installing REVEN in a VM first.
Creating and configuring the VM
VM Creation
-
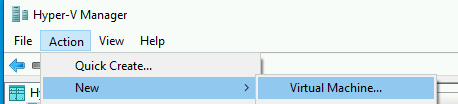
Open up the Hyper-V Manager.
-
Under the "Action" menu, select "New", then "Virtual Machine".
-
Specify the name and location you want.
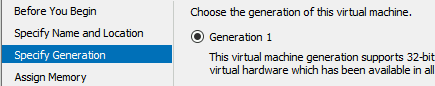
-
Specify "Generation 1" VM.
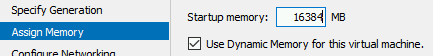
-
Select at least 16384MiB of RAM.
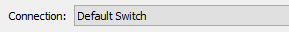
-
Select a connection that allows you to connect to this machine from your host, and also allows the VM to access the Internet. Default Switch should work on default setups:
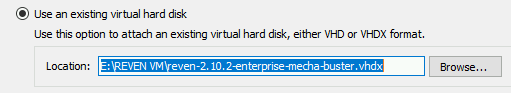
-
Next, connect to the REVEN VM disk you previously downloaded:
-
At this stage, your VM summary should look like this:
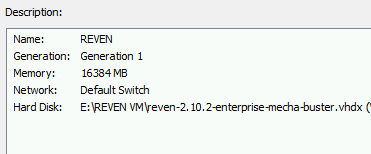
-
Click on "Finish".
Further configuration
We cannot boot the VM yet, further configuration is required:
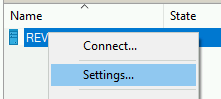
-
Open the VM's settings dialog.
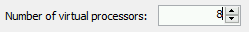
-
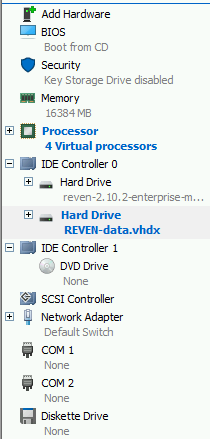
Change the number of virtual processors to the recommended 8:
-
Select the IDE disk that will serve as the data disk on Ide Controller 0. If you are upgrading from a previous VM installation, you can select the previous disk - otherwise you must create a new one:
- The disk should be VHDX.
- Dynamically expanding is acceptable.
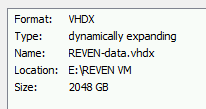
-
At this stage, your VM should look like this:
-
Finally, you must activate nested virtualization on this VM:
- Open an administrator powershell console.
- Enter the command
Set-VMProcessor -VMName <VMName> -ExposeVirtualizationExtensions $true(replace<VMName>with your VM's name)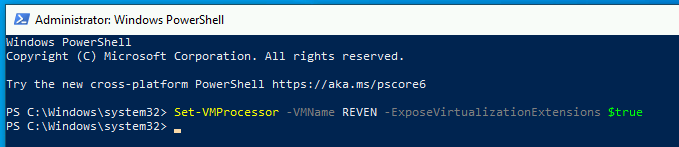
Booting it up
Your REVEN VM is now properly configured, you can go back to the general steps to install REVEN in a VM to boot it up.
REVEN in QEMU-based hypervisors
Here are the specific steps to import the pre-installed REVEN's qcow2 disk on QEMU-based hypervisors: either QEMU, virt-manager or Proxmox.
Before proceeding to the following steps, please make sure you read the general steps to install REVEN in a VM first.
Creating and configuring the VM
QEMU (command-line)
Here are are some basic guidelines for manual command-line usage.
- First create a secondary disk to hold the REVEN data:
qemu-img create -f qcow2 reven_data.qcow2 1TThis creates a 1TB disk, feel free to adapt this value to your needs. Please note that the space won't be taken by the virtual disk upon creation, it will only grow with the REVEN usage. - Second, you can start the VM:
qemu-system-x86_64 -enable-kvm -cpu host -smp 8 -m 16G -hda reven-2.11.0-free-mecha-buster.qcow2 -hdb reven_data.qcow2-enable-kvm -cpu hostwill enable VM acceleration along with nested virtualization-smp 8is the number of cores given to the VM-m 16Gis the RAM amount-hda reven-2.11.0-free-mecha-buster.qcow2is the first disk, which must be the shipped REVEN one-hdb reven_data.qcow2is the second disk, which must be the created data one
Please note QEMU's default network configuration will not allow you to reach the REVEN interface, meaning this command-line as-is won't work for real deployments.
QEMU provides multiple solutions to choose from, depending on your configuration. Please look at QEMU's documentation for more information, this page is a good starting point.
QEMU (virt-manager)
Virt Manager is QEMU-based, so you can use the qcow2 package to create a REVEN VM. Here are some basic guidelines to create your REVEN VM.
- Enter the
New Virtual Machinewindow. - Choose the
Import existing disk imageoption, and ensure thex86_64architecture is selected. - Select the
reven-2.X.Y-[...].qcow2image from one of your pools.Generic Linux 2020is suitable for the operating system option. - Set the RAM amount and CPU core number regarding your configuration and REVEN's requirements.
- Set a name to your REVEN VM, along with a suitable network configuration for you case. Keep in mind that the REVEN VM will try to get an IP address with DHCP. Also check
Customize configuration before install. - In the configuration window, find the created
VirtIOdisk, and change it toSATA. - In that same window, click
Add Hardware,Storage, and create a REVEN's data storage disk. Again, this disk must be on aSATAbus type. See REVEN's requirements for the recommended size. - Still in that window, in the
CPUssection, please ensure theCopy host CPU configurationoption is checked, so that you have nested virtualization active.
The VM is now ready.
QEMU (Proxmox)
Proxmox is also QEMU-based, so you can use the qcow2 package. Here are some basic guidelines to create
your REVEN VM.
- Start by uploading your REVEN VM disk to the Proxmox host. You can store the disk pretty much anywhere as we will import it later.
/tmpis a possible choice. - While the upload is on-going, let's create the VM: enter the
Create VMmenu in the Proxmox web UI. - In the
Generalstep, customize anything as you want. - In the
OSstep, selectDo not use any media, and ensure the guest OS is Linux with a recent kernel. - In the
Systemstep, the default are good, but adapting them is possible. - In the
Diskstep, leave only one disk for now, we will customize the disk configuration later. - In the
CPUstep, set the CPU core number regarding your configuration and REVEN's requirements. - In the
Memorystep, set the RAM amount accordingly. - In the
Networkstep, configure an interface suitable for your configuration. Keep in mind that the REVEN VM will try to get an IP address with DHCP. - In the
Confirmstep, ensure theStart after createdoption is unchecked, because we need to have a proper disk configuration before launch. - Now that the VM has been created through the web UI, please note its ID (usually 100 for the first VM in a host).
- Get a shell on the Proxmox host. SSH is a good choice, but a console access does the job too. Run the following two
commands with the VM ID you got previously (100 in the example):
qm importdisk 100 path/to/reven-2.X.Y-[...].qcow2 local -format qcow2qm set 100 --cpu host
- Now get back to the web UI for final configuration. Select the VM and go to its
Hardwaremenu. - Select the hard disk created by the wizard and detach it.
- Select the
Unused Disk 0, which is the disk you imported with the command line, and attach it as the firstSCSIdisk. - Select the
Unused Disk 1, which is the disk created by the wizard, and attach it too as a secondSCSIdisk. It's important that the REVEN disk is first, because it will be exposed as/dev/sda, whereas this second disk, that will be used for the REVEN data, will be exposed as/dev/sdb. - Once this second data disk has been re-attached, you can grow it to a reasonable size for the REVEN data, such as 1TB (see REVEN's requirements)
- Finally go to the
Optionsmenu of your REVEN VM, and update theBoot orderoption to leave only the first disk (the REVEN disk) marked as enabled.
Your VM is now ready, proceed to the next step. Keep in mind that in order to see the VM's screen, you must go to the Console menu.
Booting it up
Your REVEN VM is now properly configured, you can go back to the general steps to install REVEN in a VM to boot it up.
License installation instructions
This page will walk you through the procedure of installing the REVEN license, depending on your edition of REVEN.
After this step your REVEN installation will be fully functional. Optionally continue to the dedicated clients installation or proceed directly to the quick start guide.
Professional edition
After the first launch of the Project Manager, you will be required to install a license.
To install your license you will need to follow the steps below:
-
Point your favorite web browser to the Project Manager's homepage:
http://your-reven-host:8880/. The welcome screen will ask for your license key that was provided to you with your order of the Professional Edition. -
Provide the license key. You will then land on the license activation screen.
-
On the license activation screen, set a name for your current REVEN installation. This operation binds the license to the current server installation. You will then reach the Project Manager home screen.
-
Check the license status in the
Abouttab of the Project Manager. It should display the name of the license holder as specified in your order, the expiry date of your license and the installation name you just provided.
Enterprise edition
NOTE: An active internet connection is not required for installing a REVEN Enterprise license.
After the first launch of the Project Manager, you will be required to install a license.
To install your license you will need to follow the steps below:
-
Point your favorite web browser to the Project Manager's homepage:
http://your-reven-host:8880/. The welcome screen will ask for your license key that was provided to you with your order of the Enterprise Edition. -
Provide the license key.
-
Check the license status in the
Abouttab of the Project Manager. It should display the name of the license holder as specified in your order, if any, and the expiry date of your license.
REVEN dedicated clients installation instructions
IMPORTANT: There is no requirement to install the dedicated clients, as you can already access the various clients through a web browser by connecting to the REVEN Project Manager in the default configuration.
However, for advanced users, installing the dedicated clients can present the following advantages:
- Easier access to the clipboard in the Axion GUI.
- No risk of having keyboard shortcuts caught by the web browser before being sent to Axion or a VM.
- Ability to display Axion GUI widgets over multiple physical screens.
- IDE integration for Python scripting development.
Depending on your setup, installing the dedicated clients takes different shapes:
- Remote access: using the clients from a different machine than the server
- Local access: using the clients from the machine that is running the server
Remote dedicated clients installation
When installing dedicated clients on a machine that is different from the machine where the REVEN server is running, you can follow the procedures below.
NOTE: Installing the dedicated clients is not mandatory, as you can start Axion and Python sessions directly from the Project Manager.
Installing the Axion AppImage on a remote client
To install the Axion GUI on a remote Windows or Linux client, Tetrane provides an AppImage package.
NOTE: Again, connecting an Axion client remotely may require configuring your network. See above for more details.
Installing the Axion AppImage package on Windows 10
- Install Windows Subsystem for Linux (WSL) - follow Microsoft's doc
- Install a linux distribution: the following instructions were tested on Debian & Ubuntu, but the AppImage is designed to work on any other if you prefer a different distribution.
- Install Xming (or another X Windows Server that runs on Windows) and launch it
- Warning: if you run the AppImage in WSL2, you must start Xming through the XLaunch app and check
No Access Controlbecause both your Windows & Linux environments are going to communicate through the network.
- From the WSL shell:
- Install some dependencies from the WSL shell:
# install base dependencies sudo apt update sudo apt install x11-apps sudo apt install libgl1-mesa-glx sudo apt install libharfbuzz-bin # optionally, users can install xfce4 to have a graphical theme sudo apt install xfce4- Export the display to be able to use graphical applications:
# On WSL1 export DISPLAY=:0 # On WSL2 linux runs on a separate network than the host, so you must point to the host's address # Because of that, you must also create a Windows firewall inbound rule to allow connections to port 6000 # and ensure your X server running on the host allows connection from the WSL guest. export DISPLAY=$(awk '/nameserver / {print $2; exit}' /etc/resolv.conf 2>/dev/null):0 # And to test the display: xeyes- Execute the appimage:
/mnt/c/.../Axion-x.y.z.AppImage
When following the procedure above, you should have Axion running. However, on WSL1 and older versions of WSL2, you may encounter the following error upon executing the AppImage:
fuse: device not found, try 'modprobe fuse' first

Cannot mount AppImage, please check your FUSE setup.
You might still be able to extract the contents of this AppImage
if you run it with the --appimage-extract option.
If you see this error, you will need to take some additional steps:
- From the WSL shell:
- Extract the AppImage:
/mnt/c/.../Axion-x.y.z.AppImage --appimage-extract- Check that your version of
stripin WSL is at least 2.34. If it is not the case, please use a more recent linux distribution.
strip --version- Strip the
libQt5Core.so.5dependency inside the extracted AppImage:
strip --remove-section=.note.ABI-tag squashfs-root/usr/lib/libQt5Core.so.5- Execute Axion inside of the extracted AppImage:
./squashfs-root/AppRun
Installing the Axion AppImage package on Linux
All you need to do is make it executable and run it. It is a compressed image with all the dependencies and libraries needed to run the desired software. So there is no extraction, no installation needed. You can uninstall it by deleting it.
Installing the Python API on a remote client
Please refer to the Python API installation page.
Enabling rendering of VMs and Axion on a remote machine via X forwarding
When not locally logged in the REVEN server, but working from a remote client, you can enable the rendering of Virtual Machines (VMs) and the Axion GUI on the remote machine by enabling X forwarding.
This procedure is only available when the REVEN server has been installed from the native Debian package.
-
Ensure you have the setting
QUASAR_USE_VNCset toFalse. -
Connect to the REVEN host through SSH with X forwarding enabled:
ssh -Y your-login@your-reven-host -
Launch the Project Manager services, with the following command at the root of the installation directory:
./start.sh -
Point your favorite web browser to the Project Manager's homepage:
https://your-reven-host:8880/
NOTE: Only the ssh connection that executed the ./start.sh command will be able to display Axion and the VMs remotely. If this connection gets closed, open a new connection to ./stop.sh the REVEN server and then ./start.sh it again. In particular, this means that in this configuration, other users cannot use your REVEN
instance, as X applications such as Axion and the VMs would be redirected to your display.
NOTE: If you ever want to get back the rendering in browser of Axion and the VMs, toogle QUASAR_USE_VNC back to True.
Local dedicated clients installation
When installing dedicated clients on the machine that houses the REVEN server, you can follow the procedures below.
Enabling local rendering of VMs and Axion
When working locally on the REVEN server, you can enable the rendering of Virtual Machines (VMs) and the Axion GUI as standard Desktop applications, rather than accessing them in your browser.
-
Ensure you have the setting
QUASAR_USE_VNCset toFalse. Note that for users of the Docker package, the procedure to achieve this is a bit more involved, please refer to the relevant section. -
Launch the Project Manager services, with the following command at the root of the installation directory:
./start.shYou may need to run
./stop.shto stop the Project Manager if it was already running. -
Then point your favorite web browser to the Project Manager's homepage:
http://your-reven-host:8880/
NOTE: The Project Manager will run X programs for you to record a scenario, or to access the Axion GUI.
NOTE: If you ever want to get back the rendering in browser of Axion and the VMs, toogle QUASAR_USE_VNC back to False.
Local Python API use
Please refer to the Python API installation page.
Operating a REVEN installation
This page lists common and advanced procedures for operating a REVEN installation.
Common operations
Stopping REVEN
-
For the Docker package, simply run the
./run.shscript at the root of the Docker package. -
For the native package, simply run
./stop.shat the root of the installation directory, with the same user that previously executedstart.sh.
Upgrading REVEN
When upgrading to a new version of the package, please refer to the What's new section, and in particular the Upgrading page.
Adding symbol servers
To benefit from symbols when analyzing a trace, you can define a list of PDB servers in the Project Manager's configuration file (located in $CONFIG_PATH/quasar.py which defaults to /.config/tetrane/quasar.py).
NOTE: A default list of servers is already present in the settings file that comes with your installation. You only need to perform this step if you require additional or different servers.
- Open the Project Manager's configuration file.
- Add a new list variable
QUASAR_SYMBOL_SERVERS. - Populate the variable with PDB server addresses, here is a sample configuration:
# Symbol server list
QUASAR_SYMBOL_SERVERS = [
    "https://msdl.microsoft.com/download/symbols",
    "https://chromium-browser-symsrv.commondatastorage.googleapis.com/",
    "https://symbols.mozilla.org/",
    # "https://download.amd.com/dir/bin",
    # "https://driver-symbols.nvidia.com/",
    # "https://software.intel.com/sites/downloads/symbols/",
]
For more information, please refer to the page on Getting OSSI for Windows.
Moving a REVEN installation directory
Due to the presence of Python virtualenvs that don't support being moved, among other reasons, it is not recommended to change the location where a native REVEN package has been extracted after the installation.
If you need to change the location of your REVEN installation, the recommended procedure is to run ./stop.sh from the previous location, and then to install the package again at the desired location.
Upon running ./start.sh from the new location, you will be prompted to import the database from your previous installation.
Advanced
Running multiple REVEN instances on the same machine
You can run multiple instances of Project Manager on the same machine, as long as you set the multiple web interfaces to listen on different ports. You have two solutions to do that:
- Give the port number to
start.shas its first argument:./start.sh 4000will make the web interface accessible on port 4000. - Set the port number permanently in one of your setting files, with the
variable
QUASAR_UWSGI_PORT, depending on your deployment configuration.
Running REVEN behind a reverse-proxy
It's no problem running a REVEN instance behind a reverse-proxy, as long as you follow those recommendations:
- When using the Docker package:
- (optional) Change the port on which the web interface listen (e.g. 8888 for both UWSGI and Jupyter)
- Ensure the
QUASAR_USE_VNCvalue is set toTrue(default value) - Set the
QUASAR_WEBSOCKIFY_PUBLIC_PORTto the proxied value (e.g. 80) - Set the
QUASAR_JUPYTER_PUBLIC_PORTto the proxied value (e.g. 80)
- When using the native package:
- (optional) Change the
QUASAR_UWSGI_PORTto a custom value (e.g. 8888) - Ensure the
QUASAR_USE_VNCvalue isTrue(default value) - Set the
QUASAR_WEBSOCKIFY_PORTto a fixed value (e.g. 6080) - Set the
QUASAR_WEBSOCKIFY_PUBLIC_PORTto the proxied value (e.g. 80) - Set the
QUASAR_JUPYTER_PORTto a fixed value (e.g. 8888) - Set the
QUASAR_JUPYTER_PUBLIC_PORTto the proxied value (e.g. 80)
- (optional) Change the
Here is an example of a working nginx configuration using the above example values:
server {
    listen 80;

    client_max_body_size 10G; # You won't be able to upload files bigger than this value.

    location / {
        proxy_pass http://127.0.0.1:8888/;
        proxy_http_version 1.1;
        proxy_set_header X-Forwarded-For $proxy_add_x_forwarded_for;
        proxy_set_header X-Forwarded-Proto $scheme;
        proxy_set_header Host $host;
        proxy_set_header Authorization ""; # Ensure we clear the Authorization header for DRF.
    }

    location /websockify {
        proxy_pass http://127.0.0.1:6080/websockify;
        proxy_http_version 1.1;
        proxy_set_header Upgrade $http_upgrade;
        proxy_set_header Connection $http_connection;
        proxy_read_timeout 1800s; # Default is 60s, which is really low in this use-case.
    }

    location /jupyter/ {
        proxy_pass http://127.0.0.1:8888/jupyter/;
        proxy_http_version 1.1;
        proxy_set_header Host $host;
        proxy_set_header Upgrade $http_upgrade;
        proxy_set_header Connection $http_connection;
    }
}
Troubleshooting
If you have any trouble somewhere, don't hesitate to take a look at the logs
located in ~/Reven2/<version>/Logs and see the Support page for any help.
Quick start: from a fresh installation to your first analysis
This section will guide you through getting started with REVEN. By following this guide you will go from a fresh, working installation of REVEN to your first scenario and first analysis.
This guide makes the following assumptions about your environment:
- You have a working installation of REVEN - if not, please see the Installation section first.
- Both your machine and the machine on which REVEN is installed (they can be the same machine!) have an active Internet access. This is to retrieve some resources online. If working from an airgapped network, you will need to retrieve these resources through your standard procedures to be able to follow this guide.
This section will guide you through the following steps:
- Import a first Virtual Machine (VM) so we have a guest environment to record. You will:
- Download a VM disk image from an Internet resource.
- Import this disk image into REVEN.
- Configure the guest to make it a good recording environment.
- Save a VM live snapshot you can use to record software later on.
- Record your first scenario. You will:
- Create a new scenario.
- Record the execution of a system binary such as
hostname. - Replay the scenario.
- Start analyzing that scenario. You will:
- Open Axion, the analysis GUI, on this scenario.
- Follow the built-in analysis tutorial.
Once you have followed all these steps, you will be ready to record your own scenarios using the existing environment, or import VMs of your own.
To start, please head over to the first section: Import a first VM.
Importing a first Virtual Machine
In this section, we will import our first Virtual Machine (VM) into REVEN, so that we can later record this guest environment.
REVEN supports Windows or Linux guests, so depending on your target of choice please follow either one of the following sections:
Windows 10
This section will cover downloading an existing, freely available Windows 10 Virtual Machine, uploading it to REVEN and configuring it to make it a good recording environment.
Downloading the VM
Microsoft provides Windows 10 Virtual Machines that can be downloaded from the Internet. For this guide, we will use the MSEdge from the Tool VMs page.
- Navigate to the Tool VMs page VM page
- Please review the license terms.
- Select the
MSEdge on Win10 (x64) 1809VM, then theHyperVplatform. - Click on Download.
- Unzip the
MSEdge.Win10.HyperV.zipfile you just downloaded on your machine.
Provisioning the VM disk
We will now upload the MSEgde's disk to the REVEN server, a step known as provisioning:
-
Open up your REVEN installation's Project Manager (by default, point a web browser to
http://<your_reven_host>:8880) -
Select the
VM Managertab. -
Click on
Register QEMU VM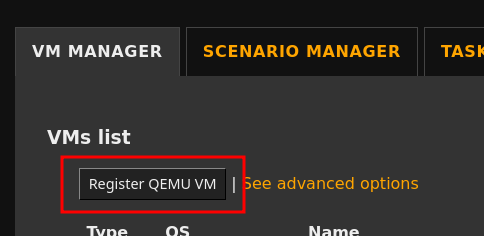
-
The VM Import Wizard welcome screen shows up - click on
Start. -
In the
Select VMscreen, locate theProvision a new VMsection and click onUpload a new VM file from disk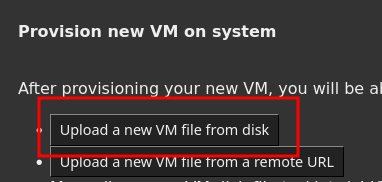
-
Click on
Browse. -
On your disk, select the
Virtual Hard Disks/MSEdge - Win10.vhdxextracted from the archive earlier. -
Click on
Upload.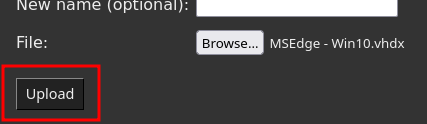
-
When the upload is over, click on
Next. You are back at theSelect VMscreen.
Registering the VM
Now that the VM disk is available to the REVEN server, it is time to register it as a new VM.
Starting the registration
-
After the end of the provisioning step, you were taken back to the
Select VMscreen. -
Locate the
Register a new VMsection. -
Ensure the disk file we uploaded is selected in the combo box. If not, select it.
-
Click on
Register.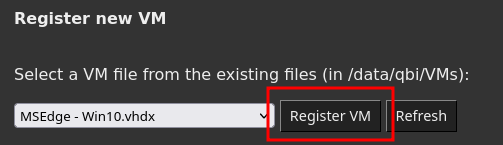
-
This disk requires conversion to the
qcow2format REVEN uses:- Check
Remove original file. - Click on
Convert. - When the operation is over, click on
Next.
- Check
-
In the
Specify guestpage, select the following options for this VM:-
OS:
Windows. -
Architecture:
x64. -
Leave the other options unchanged.
-
Click on
Next.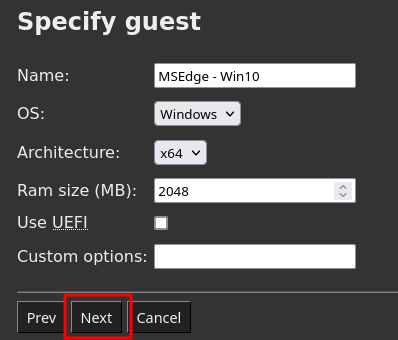
-
-
On the
Create disk snapshotscreen, clickNext.
Booting the VM for the first time
We are now ready to boot this disk for the first time.
- Boot the VM:
- Check
Enable network. - Click on
Start. - Click on
Show in browser: the VM screen appears in a new tab or window. - Log in: use the password
Passw0rd!(as specified on the Microsoft VM page). - Wait for the desktop to appear.
- Check
Configuring the guest
Now that the VM is booted, it is time to configure the guest environment:
- In the Project Manager, click on
Insert Windows 10 lightener CDROM. - Go back to the VM screen.
- Disable the KPTI protections:
- Point a file explorer to the CD-ROM drive.
- Right-click on the file
disable-kpti.batand selectRun as administrator. - Wait for the VM to reboot and log in again.
- Disable the CompactOS option:
- Right-click on the Start menu.
- Click on
Windows PowerShell (Admin). - Type in
Compact.exe /CompactOs:Never. - Wait for the operation to finish.
- Finally, make the VM lighter:
- Disable Windows Defender:
- Right-click on the Start menu, select
Run. - Type in
gpedit.mscand press Enter. - Navigate to
Local Computer Policy\Computer Configuration\Administrative Templates\Windows Components\Windows Defender Antivirus\. - Double-click on
Turn off Windows Defender Antivirusand set theEnabledradio button. - Close the Group Policy editor window.
- Right-click on the Start menu, select
- Run the provided script:
- In an Admin PowerShell window, type in
Set-ExecutionPolicy Unrestricted. - Confirm with
Y. - Then type
D:\windows10_lightener.ps1. - A dialog pops up, click on
OK. - When asked to reboot, click on
OK. - Log in again.
- In an Admin PowerShell window, type in
- Re-enable network-related services:
- Right-click on the Start menu, select
Run. - Type in
services.mscand press Enter. - Enable the service
Windows Event Logby double-clicking it, selectingAutomaticstartup type and clickingOK.
- Right-click on the Start menu, select
- Force .NET 4 precompilation step:
- In an admin shell, type in:
C:\Windows\Microsoft.NET\Framework64\v4.0.30319\ngen.exe update /force.
- In an admin shell, type in:
- Disable Windows Defender:
Installing tools
At this point, we have done everything that is strictly necessary for REVEN. However, it is a good idea to install Visual Studio's runtimes and other tools to make using this VM easier.
- From your VM, open up the Edge browser.
- If the network does not work:
- Go back to the Project Manager
- Click on
ACPI shutdown. - Check
Enable network. - Click on
Start. - Wait for the VM to boot and log back in: the network should now work.
- Install the following tools - you can type the page's URLs or search for their title in your favorite search engine:
vc_redist.x64.exefiles from The latest supported Visual C++ downloads - at least 2019 and 2013 versions.- Install Autologon64 to avoid typing the autologon password:
- Unzip the downloaded file.
- Run
Autologon64.exe. - Agree to the terms.
- Enter the login password
Passw0rd!and clickEnable. - Check that autologon works by restarting Windows.
At this point, optionally you can also install any software you might want: a web browser, etc.
Finishing configuration
Now that your VM is configured, turn it off:
- Go back to the Project Manager.
- Click on
ACPI shutdown. - Click on
Next. - You can skip
Finalize VM preparationso Click onNextagain.
Taking the first Live Snapshot
Now that the VM is off, it is time to boot it into Emulation mode (which is the mode we can record in) and take a handy live snapshot for future recording sessions:
-
Click on
Start. -
Click on
Show in browser. -
The VM will now automatically boot and log in. Wait a few minutes for the desktop to appear - this is slower than earlier, because of the emulation mode.
-
We know Windows shows the desktop as soon as possible but keeps starting processes in the background. At this point, we want to wait until the boot process is effectively finished:
- Right-click on the Start menu and click on
Task Manager. - Wait for the CPU activity to drop to about 10-20% - usually the Task Manager itself will consume about 10-15%.
- Close the task manager.
- Right-click on the Start menu and click on
-
We will often use a command-line during recording sessions, so we might as well start one now:
- Right-click on the Start menu and click on
Run. - Type in
cmdand press Enter. - Wait for the shell to appear.
- Right-click on the Start menu and click on
-
The VM is ready, it is time to take our live snapshot:
- Go back to the Project Manager.
- Locate the
Take a live snapshotfield. - Type in a name,
booted-cmdfor instance. - Click on
Save.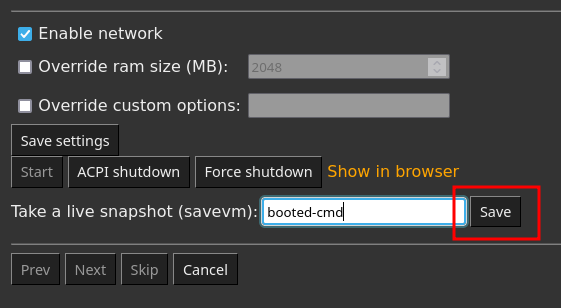
-
Now that a live snapshot exists, we can safely force shutdown the VM because we will always be restoring a known good state: click on
Force shutdown. -
Click on
Next.
Preparing the snapshot
- On the
Prepare the snapshotscreen, click onPrepare. - Wait for the task to finish. This will take several minutes.
- Click on
Finish.
And that is it! We now have a VM with a guest environment tuned for a good recording experience. It is time to Record our first scenario.
Windows 7
This section will cover downloading an existing, freely available Windows 7 Virtual Machine, uploading it to REVEN and configuring it to make it a good recording environment.
Downloading the VM
Microsoft provides Windows 7 Virtual Machines that can be downloaded from the Internet. For this guide, we will use the IE11 VM from the Tool VMs page.
- Navigate to the Tool VMs page VM page
- Please review the license terms.
- Select the
IE11 on Win7 (x86)VM, then theHyperVplatform. - Click on Download.
- Unzip the
IE11.Win7.HyperV.zipfile you just downloaded on your machine.
Note that the Windows 7 VMs provided by Microsoft are 32-bit machines. You can use your own 64-bit VM with REVEN, but this guide assumes you are using the IE11 32-bit VM.
Provisioning the VM disk
We will now upload the IE11's disk to the REVEN server, a step known as provisioning:
-
Open up your REVEN installation's Project Manager (by default, point a web browser to
http://<your_reven_host>:8880) -
Select the
VM Managertab. -
Click on
Register QEMU VM -
The VM Import Wizard welcome screen shows up - click on
Start. -
In the
Select VMscreen, locate theProvision a new VMsection and click onUpload a new VM file from disk -
Click on
Browse. -
On your disk, select the
Virtual Hard Disks/IE11 - Win7.vhdxextracted from the archive earlier. -
Click on
Upload.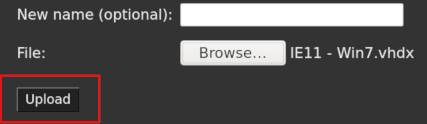
-
When the upload is over, click on
Next. You are back at theSelect VMscreen.
Registering the VM
Now that the VM disk is available to the REVEN server, it is time to register it as a new VM.
Starting the registration
-
After the end of the provisioning step, you were taken back to the
Select VMscreen. -
Locate the
Register a new VMsection. -
Ensure the disk file we uploaded is selected in the combo box. If not, select it.
-
Click on
Register.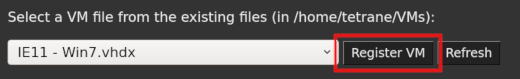
-
This disk requires conversion to the
qcow2format used by REVEN:- Check
Remove original file. - Click on
Convert. - When the operation is over, click on
Next.
- Check
-
In the
Specify guestpage, select the following options for this VM:-
OS:
Windows. -
Architecture:
x86. -
Leave the other options unchanged.
-
Click on
Next.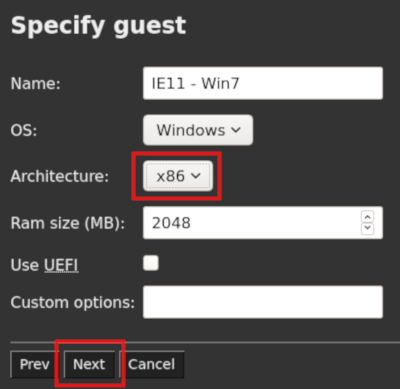
-
-
On the
Create disk snapshotscreen, clickNext.
Booting the VM for the first time
We are now ready to boot this disk for the first time.
- Boot the VM:
- Check
Enable network. - Click on
Start. - Click on
Show in browser: the VM screen appears in a new tab or window. - Wait for the desktop to appear. No login is necessary. If needed, the password is
Passw0rd!(as specified on the Microsoft VM page). - The VM might request a restart on the first boot. Kindly oblige.
- Check
Configuring the guest
Now that the VM is booted, it is time to configure the guest environment:
-
In the Project Manager, click on
Insert Windows 10 lightener CDROM.NOTE: Despite the name, this CDROM contains utilities that are useful for Windows 7 too.
-
Go back to the VM screen.
-
Disable the KPTI protections:
- Point a file explorer to the CD-ROM drive.
- Right-click on the file
disable-kpti.batand selectRun as administrator. - Wait for the VM to reboot.
-
Finally, make the VM lighter:
- Disable Windows Defender:
- Press Windows+R to make the "Run" window appear.
- Type in
gpedit.mscand press Enter. - Navigate to
Local Computer Policy\Computer Configuration\Administrative Templates\Windows Components\Windows Defender\. - Double-click on
Turn off Windows Defender Antivirusand set theEnabledradio button. - Click OK or Apply to close the Group Policy editor window.
- Force .NET 4 precompilation step:
- In an admin shell, type in:
C:\Windows\Microsoft.NET\Framework\v4.0.30319\ngen.exe update /force.
- In an admin shell, type in:
- Disable Windows Defender:
Installing tools
At this point, we have done everything that is strictly necessary for REVEN. However, it is a good idea to install Visual Studio's runtimes and other tools to make using this VM easier.
- From your VM, open up the Internet Explorer browser.
- If the network does not work:
- Go back to the Project Manager
- Click on
ACPI shutdown. - Check
Enable network. - Click on
Start. - Wait for the VM to boot: the network should now work.
- Install the following tools - you can type the page's URLs or search for their title in your favorite search engine:
vc_redist.x86.exefiles from The latest supported Visual C++ downloads - at least the 2019 and 2013 versions.
At this point, optionally you can also install any software you might want: a web browser, etc.
Finishing configuration
Now that your VM is configured, turn it off:
- Go back to the Project Manager.
- Click on
ACPI shutdown. - Click on
Next. - You can skip
Finalize VM preparationso Click onNextagain.
Taking the first Live Snapshot
Now that the VM is off, it is time to boot it into Emulation mode (which is the mode we can record in) and take a handy live snapshot for future recording sessions:
-
Click on
Start. -
Click on
Show in browser. -
The VM will now automatically boot and log in. Wait a few minutes for the desktop to appear - this is slower than earlier, because of the emulation mode.
-
The VM will prompt you for a reboot due to the change in device drivers that accompany switching to Emulation Mode. Let it reboot.
-
We know Windows shows the desktop as soon as possible but keeps starting processes in the background. At this point, we want to wait until the boot process is effectively finished:
- Right-click on the Start menu and click on
Start Task Manager. - Wait for the
System Idle ProcessCPU value in the "Processes" tab to be around 80-90% for a while- usually the Task Manager itself will consume about 10-15%. - Close the task manager.
- Right-click on the Start menu and click on
-
We will often use a command-line during recording sessions, so we might as well start one now:
- Press Windows+R
Run. - Type in
cmdand press Enter. - Wait for the shell to appear.
- Press Windows+R
-
The VM is ready, it is time to take our live snapshot:
- Go back to the Project Manager.
- Locate the
Take a live snapshotfield. - Type in a name,
booted-cmdfor instance. - Click on
Save.
-
Now that a live snapshot exists, we can safely force shutdown the VM because we will always be restoring a known good state: click on
Force shutdown. -
Click on
Next.
Preparing the snapshot
- On the
Prepare the snapshotscreen, click onPrepare. - Wait for the task to finish. This will take several minutes.
- Click on
Finish.
And that is it! We now have a VM with a guest environment tuned for a good recording experience. It is time to Record our first scenario.
Linux
This section will cover downloading a pre-configured Linux Virtual Machine from the Tetrane website, uploading it to REVEN and registering it to create a recording environment.
Downloading the VM
Tetrane provides multiple resources from its website, including pre-configured VMs for use as recording environments.
-
Navigate to the Tetrane VMs page.
-
Choose one of the distributions - this guide assumes you picked Fedora 27.
NOTE: If using the Free Edition, the only compatible distribution is Debian 9 Stretch, so choose this one.
-
Download either the
qcowor thezipversion. -
If you chose the
zipversion, unzip the archive you downloaded.
Provisioning the VM disk
We will now upload the VM disk to the REVEN server, a step known as provisioning:
-
Open up your REVEN installation's Project Manager (by default, point a web browser to
http://<your_reven_host>:8880) -
Select the
VM Managertab. -
Click on
Register QEMU VM -
The VM Import Wizard welcome screen shows up - click on
Start. -
In the
Select VMscreen, locate theProvision a new VMsection and click onUpload a new VM file from disk -
Click on
Browse. -
On your disk, select the
*.qcow2disk image file extracted from the archive earlier. -
Click on
Upload.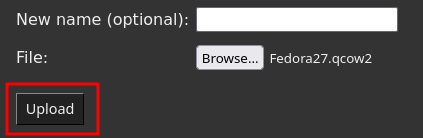
-
When the upload is over, click on
Next. You are back at theSelect VMscreen.
Registering the VM
Now that the VM disk is available to the REVEN server, it is time to register it as a new VM.
Starting the registration
-
After the end of the provisioning step, you were taken back to the
Select VMscreen. -
Locate the
Register a new VMsection. -
Ensure the disk file we uploaded is selected in the combo box. If not, select it.
-
Click on
Register.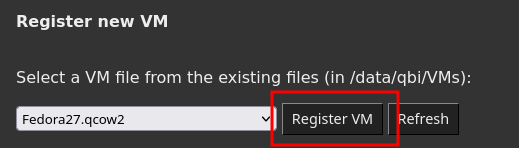
-
In the
Specify guestpage, select the following options for this VM:-
OS:
Linux. -
Architecture:
x64. -
Leave the other options unchanged.
-
Click on
Next.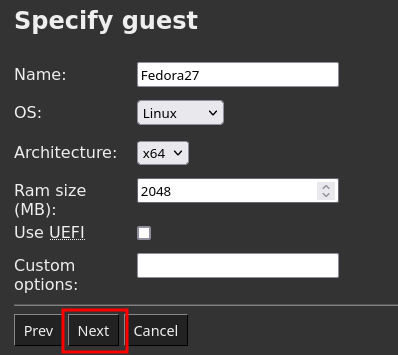
-
-
On the
Create disk snapshotscreen, clickNext.
Booting the VM for the first time
We are now ready to boot this disk for the first time.
- Boot the VM:
- Check
Enable network. - Click on
Start. - Click on
Show in browser: the VM screen appears in a new tab or window. - Log in: the user is
robertand the password - Wait for the desktop to appear.
- Check
Configuring the guest
The VM you downloaded is already configured to be a good recording environment, so you don't have to do anything in that regard. Notably:
- It is a compatible kernel.
- KASLR and PTI have been disabled.
- Debug packages are generally downloaded on the disk.
- A light desktop environment is installed (Xfce).
Installing tools
At this point, you can install more software on the VM if you want, but this is not strictly necessary. Here are some general guidelines:
- If you pull software from the package manager, pull the debug packages along as well to make sure you get symbols later on.
- Do not update the VM - REVEN supports a certain set of kernels and you would risk going out of the perimeter.
Finishing configuration
Now that your VM is configured, turn it off:
- In the VM screen, click on
Applications,Log out,Shut Down. - Back to the Project Manager, click on
Next. - You can skip
Finalize VM preparationso Click onNextagain.
Taking the first Live Snapshot
Now that the VM is off, it is time to boot it into Emulation mode (which is the mode we can record in) and take a handy live snapshot for future recording sessions:
-
Click on
Start. -
Click on
Show in browser. -
Wait a few minutes for the login screen to show up and log in - this is slower than earlier, because of the emulation mode.
-
Wait for the desktop to appear.
-
Linux will keep initializing things in the background, so we want to make sure the boot process is effectively over:
- Open up a Terminal emulator if one is not started automatically.
- Type in
htop. - Wait for the general CPU activity to be below 20%.
- Quit
htop.
-
We will often use a command-line during recording sessions, so keep this one open, although you can call
clear. -
The VM is ready, it is time to take our live snapshot:
- Go back to the Project Manager.
- Locate the
Take a live snapshotfield. - Type in a name,
booted-cmdfor instance. - Click on
Save.
-
Now that a live snapshot exists, we can safely force shutdown the VM because we will always be restoring a known good state: click on
Force shutdown. -
Click on
Next.
Preparing the snapshot
- On the
Prepare the snapshotscreen, click onPrepare. - Wait for the task to finish. This will take several minutes.
- Click on
Finish.
And that is it! We now have a VM with a guest environment tuned for a good recording experience. It is time to Record our first scenario.
Record a first scenario
Now that we have a Virtual Machine ready, it is time to do our first recording.
Creating a new scenario
The first step is to initiate a new scenario, where the Project Manager can store one recording and its resources.
-
In the Project Manager, click on the
Scenario Managertab. -
Click on
New scenario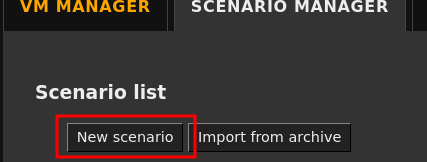
-
Enter a name for your scenario, such as
First Scenario. -
In the
Snapshotcombo box, pick therootsnapshot of the VM you have imported earlier.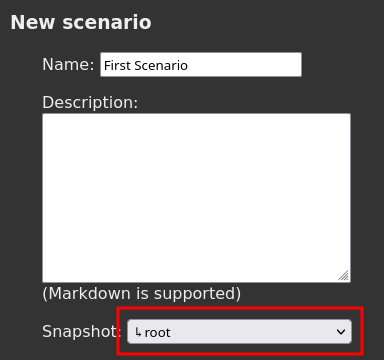
-
Click on
Nexton the top-right corner of the page. -
On this page, you could upload and make new files available to your VM via the CD-Rom. However, in our case, we will record a system binary, so we can skip it. Click
Next.
Recording the hostname binary
You are now seeing the main recording page. You should recognize the VM control buttons from when we imported it.
-
First, locate the live snapshot you created earlier.
-
Restore this snapshot by clicking
Start(note the snapshot name can vary).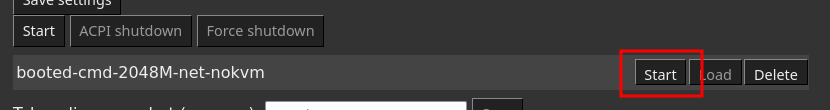
-
Once the snapshot is restored,
Show in browserappears: click on it. -
Make sure you have both the Project Manager page and the VM screen in view, so you can quickly navigate from one to the other.
-
In the VM screen, you should have a console opened. Type in
hostname, but do not press Enter yet. -
We will record the execution of this command:
-
Click on
Start recordin the Project Manager.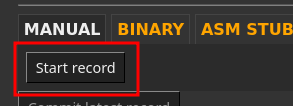
-
Quickly select the VM screen tab and press Enter. This will effectively start the command we typed in earlier.
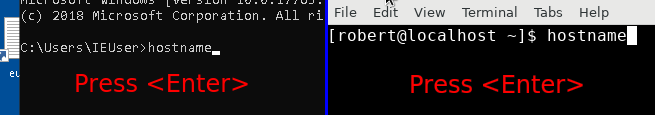
-
The command's execution should be almost instantaneous.
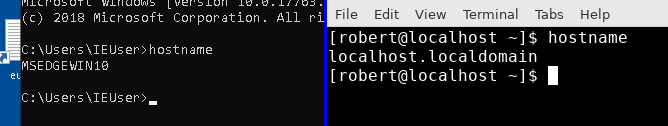
-
As soon as you see the output in the VM screen, click on
Stop recordon the Project Manager page.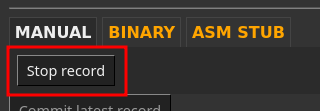
-
-
You can redo this recording with
Start recordandStop recordagain as many times as you want, until you get a short recording. -
Once you are satisfied with your recording, click on
Commit latest record. -
Force shutdownthe VM to save on CPU ressources. Note that this is quickest way to shut the VM down, and it is safe because the next recording session will likely start from the known good live snapshot anyway. -
Click on
Next.
Replaying
The next screen is the Replay screen, were REVEN will extract the trace from the recording and build indexes.
-
Keep all the defaults and click on
Replayat the bottom of the screen.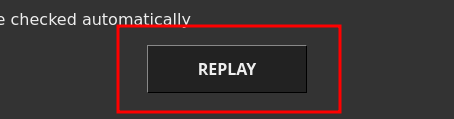
-
Wait for all ressources to be done and at 100%. This will take a few minutes.
-
Click on
Next.
You are now on the Analyze page. Head over to the next Analyze section.
Analyze your first scenario
Now that we have a first scenario, it is time to take a look at it.
The analyze page
If you followed the guide this far, you should have landed on the scenario's Analyze page. To find this page again:
- Click on the
Scenario Managertab. - Locate your scenario in the table.
- To the right are multiple buttons, each corresponding to a page we have seen so far.
- Click on
Analyze.
On this Analyze page are multiple buttons. You can:
- Start or Stop the REVEN server for this scenario.
- Start Tetrane's analysis GUI named Axion.
- Open up the Jupyter interface for Python scripting.
NOTE: As the latter two options require a REVEN server, they will start it up automatically if it is not already running for this scenario.
The analysis GUI Axion
-
Click on
Start Axion. Note this will automatically start the scenario's REVEN server as well.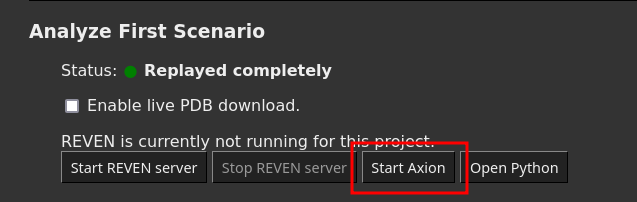
-
Click on
Show in browserto open the Analysis GUI.
The GUI opens up and various widgets show you the content of the trace. By default, the GUI points at the beginning of the trace, and since we started recording manually, you are probably looking at some system code.
Moreover, if this is the first time your start Axion, the GUI Tutorial has popped up. If not, start it manually:
-
Click on the
Tutorialbutton located on the toolbar.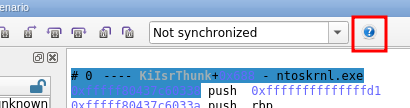
-
Follow the tutorial up to the end: you will learn about all widgets and the basics of trace navigation.
-
Close the tutorial.
Once this is done, there are a few things we can start looking at in our trace. Note there might be slight differences depending on whether the guest you recorded is a Windows or Linux VM.
Finding the entry point
We want to skip the system code and jump straight at the program's entry point.
- Start a
Symbol callsearch on the binaryhostnameand symbolwmain:- Start typing
hostnamein the binary path field. - Use the autocomplete to select the full binary path.
- Move to the symbol name field, start typing
main. - Select the proper entry point (
wmainon Windows) - Press Enter to start the search
- Go to the next result by pressing F4.
- Start typing
- Bring up the Calltree widget: you can now start exploring the binary's trace.
Linking the printed string to its source
NOTE: On Linux traces and especially at the beginning of a program, your are likely to see calls such as init+0x56 where you would expect libc calls: this is the library loader dynamically finding the destination the first time a call to a particular library function is made. This gets better when more and more calls are resolved.
-
Try to find the function call responsible for printing the hostname on the command line:
-
In the Calltree widget, unfold the calls made by the
mainfunction and children. You are looking for a function name containingputorprint. -
To check a candidate that could print what you want, double-click on it.
-
Look at the registers to see the call's arguments. You can double-click on a register value to open up a memory view at the register's address.
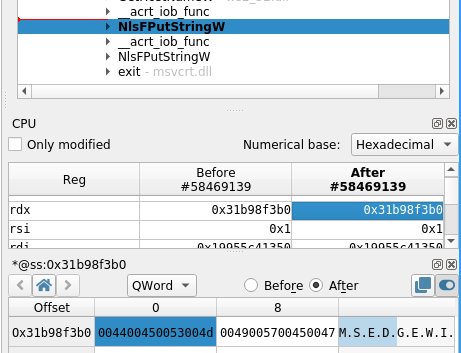
-
If you see the hostname in the memory view, you have find your output buffer.
-
-
Try to see where this buffer is coming from:
-
Open up the memory history on the output buffer but checking
Show access history of selection.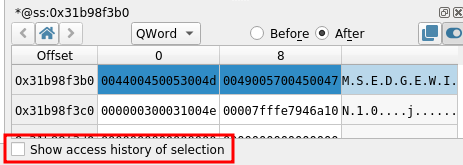
-
The closest access that occurred before the point in time we are at will be selected. Double-click on the closest Write access to see where this address was written to last.
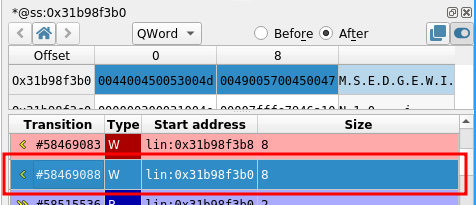
-
Look at the current symbol, and the Calltree or the Backtrace: you traveled back to when the hostname was fetched.
-
Python API
We can also use the Python API to get information from a trace.
-
Go back to the scenario's
Analyzepage. -
Click on
Open Python -
Create a new notebook:
-
Click on
Newat the top-right corner. -
Select a
reven-2.x.xnotebook.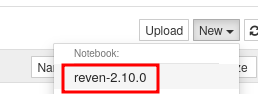
A new notebook has opened. You can type python code into cells and execute them.
-
-
Type in
print("hello")into the top-most cell and execute it by pressing Ctrl+Enter. -
Spawn a new cell with the
+toolbar button.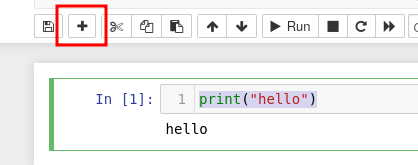
-
You are now ready to follow the Python Quick Start guide using this notebook.
What's next
This quick start guide is now over. At this point, there are multiple things you can do:
- Read more about Managing VMs, especially the Need to Know section for more details about certain steps we took during this guide.
- Use the registered VM to record new scenarios with your own binaries:
- Use the
Select files to make available on the VMstep to push new files - On the recording screen, click on
Insert Scenario CDROMto mount the CD-ROM on the guest.
- Use the
- Take a look at pre-recorded scenarios you can download, import into your REVEN installation and analyze.
What's new?
REVEN 2.11.0 contains a new set of features, improvements and fixes.
- Packages and Compatibility information
- Features, improvements and fixes
- Upgrading from REVEN 2.x
- Known issues and limitations
Packages and Compatibility information
REVEN packages are available for several platforms:
- REVEN Archive to install on Debian 10 Buster amd64
- Docker Image installable on any Linux amd64
- VMware Disk Image installable in VMs with VMware hypervisors
- Hyper-V Disk Image installable in VMs with the Microsoft Hyper-V hypervisor
- Qcow2 Disk Image installable in VMs with hypervisors such as KVM, Proxmox, Oracle VM VirtualBox
Axion is also available as an AppImage:
- AppImage installable on any Linux amd64 and Windows 10 via WSL
See also this version's compatibility information.
Archive content
This archive shipment consists of an archive file reven-2.11.0.tar.gz with the following content:
reven-2.11.0.tar.gz: full REVEN archive containing the Project Manager, server, clients and their dependenciesREADME.pdf: document containing installation guidelines for REVENREADME.md: text version ofREADME.pdfdoc/: directory containing text version of the documentationexamples/: directory containing various Python API examplesinstall.sh: script to run as root to install the dependenciesstart.sh: script to run as REVEN user to start the REVEN Project Managerstop.sh: script to stop the running REVEN Project Managersettings.py: the Project Manager settings
python-doc: directory containing the Python API reference in HTML formattools: directory containing various downloadable tools and subpackages:debian_upgrade: helper scripts for the Debian upgrade procedureREVEN-2.11.0-python3.7-debian-buster.tar.gz: Python 3.7 Debian Buster amd64 Python API packageREVEN-2.11.0-python3.7-windows.zip: Python 3.7 Windows 10 64-bit Python API packageREVEN-2.11.0-windows-lightener.zip: An utility that makes Windows VMs lighter to ease recording with REVEN.REVEN-2.11.0-asm-stub-utility.zip: Small library that encapsulates in C functions the ASM instructions used to start/stop records from the guest.REVEN-2.11.0-rvn-kd-bridge.zip: Windows utility to connect WinDbg to a REVEN server.
third-parties: directory containing plugins for third-party tools:REVEN-2.11.0-third-parties-volatility-plugin.zip: A REVEN plugin for volatility
Supported installation environments
Starting with REVEN 2.8.0, the supported installation environment for the REVEN Project Manager and Axion is Debian 10 Buster amd64. For the REVEN v2 Python API, the supported installation environments are Debian 10 Buster amd64 and Windows 10 64-bit. For the REVEN Kd Bridge, the supported installation environment is Windows 10 64-bit.
Docker content
This docker shipment consists of an archive file reven-2.11.0.tar.gz with the following content:
reven-2.11.0-docker.tar.xz: full REVEN docker containing the Project Manager, server, clients and their dependenciesdebian_upgrade: helper scripts for the Debian upgrade procedureREADME.pdf: document containing installation guidelines for the docker imageREADME.md: text version ofREADME.pdfreven2:2.11.0.docker: docker imagerun.sh: wrapper script to launch and stop REVEN.
Supported installation environments
While the system prerequisites to install the archive REVEN package is Debian 10 Buster amd64, this docker package can be installed to run REVEN on any Linux distribution.
Vmdk Disk
This Vmdk shipment consists of a vmdk disk image file reven-2.11.0.vmdk.
Supported installation environments
This package can be installed to run REVEN in a VM on VMware hypervisors.
Vhdx Disk
This Vhdx shipment consists of a vhdx disk image file reven-2.11.0.vhdx.
Supported installation environments
This package can be installed to run REVEN in a VM on the Microsoft Hyper-V hypervisor.
Qcow2 Disk
This Qcow2 shipment consists of a qcow2 disk image file reven-2.11.0.qcow2.
Supported installation environments
This package can be installed to run REVEN in a VM on hypervisors such as KVM, Proxmox, Oracle VM VirtualBox.
AppImage content
The AppImage shipment consists of a file v2.11.0.ai that can be used to run the Axion GUI.
Supported installation environments
While the system prerequisite to install the archive REVEN package is Debian 10 Buster amd64, this AppImage package can be used to run the Axion GUI on any Linux distribution or on Windows 10.
Compatibility information
VM Snapshots
Snapshots that were prepared in a version before 2.7 must be prepared again to update their filesystem.
A snapshot must be prepared for the automatic binary recording to be available on that snapshot and to replay the OSSI feature in a scenario associated to that snapshot.
To update the filesystem of a snapshot, perform the following actions:
- Open the Project Manager
- Go to the VM Manager tab
- Click the name of the snapshot that you wish to prepare again (snapshots that must be prepared anew are marked as incompatible with a red dashed circle icon).
- In the snapshot page, click the Update button.
Bookmarks
Due to how bookmarks are now stored server-side, bookmark files (*.rbm) cannot be used directly in version 2.5 or superior.
You can use the import_bookmarks.py script (in the Download page of the Project Manager) to import the legacy rbm
files.
Resource compatibility
2.7
The following resource replayed in a version before 2.7 is deprecated and should be deleted:
Fast Search/Binary Ranges
To benefit from the Filters and Fast Search features in version 2.7 and superior, the new OSSI Ranges resource must be
replayed:
Fast Search/OSSI Ranges, orFilters/OSSI Ranges
In order to delete deprecated resources and generate new resources, perform the following actions:
- Open the Project Manager
- Go to the Scenario Manager tab
- Click the Update button on the lines corresponding to the names of the scenario you want to update.
2.3
The following resources replayed in a version before 2.3 must be deleted and replayed:
Light OSSI/kernel_descriptionBacktrace/stack_eventsFast Search/binary_ranges
In order to do so:
- Open the Project Manager
- Click the Scenario Manager tab
- Click the name of the scenario you want to replay (scenarios with outdated resources are indicated by red and orange dots next to the scenario status)
- Click Replay
- Delete the resources, select them for replay and click replay.
General compatibility information
-
This version is backward compatible with artifacts from previous 2.x versions such as VMs, VM snapshots, scenario recordings and resources not listed above.
-
Scenarios recorded with version 2.6 or later cannot be replayed with a version of REVEN prior to 2.6.
-
Following a bugfix, should you decide to replay pre-2.6 trace and memory history in version 2.6 or superior, transition numbers will be different after the replay. For this case, we provide a script (to run after replaying the trace and memory history) that updates bookmarks you would have set on the scenario before upgrading. You should run this script if you notice that the bookmarks of a scenario are no longer at the correct location after upgrading and replaying the trace and memory history. We recommend you backup the
bookmarks.sqlitefile in theUserDatadirectory of your scenario before running this script. The script can be downloaded from the "DOWNLOADS" page of the Project Manager, in the "Python API - Analyze" example section. -
When replaying either the trace or the memory history for a QEMU scenario recorded pre-2.2.0, take care to replay both the trace and the memory history: due to a bug fix, traces may have their number of transitions increased by 1, or a modified last context.
-
Live QEMU snapshots created in a version before 2.1.0-beta may exhibit an undesirable mouse cursor behavior where the mouse cursor of the guest is displayed at a different position than the actual mouse cursor from the controlling host. Affected live snapshots must be removed and created again from a running VM.
2.11.0
Highlights
REVEN version 2.11 is packed with new features, with the following highlights:
- A fuzzing and triage platform to analyze crashes found by a fuzzer using REVEN's powerful features such as semantic tainting.
- A new WinDbg-assisted workflow to perform fine-grained recording of Windows scenarios, whether applicative or full-system, at the breakpoint level.
- The most "featureful" release of the Analysis Python API since REVEN 2.2 (which introduced the API)! This release introduces:
- Essential vocabulary types such as
MemoryRange,RegisterSlice. - Helpers for the Taint API that facilitate the implementation of semantic tainting.
- A new API to inspect handles inside the trace of a Windows scenario.
- An extension of the Type API to read data structures in the trace of a Windows scenario, directly after their description in the PDBs.
- Essential vocabulary types such as
In more details:
-
Fuzzing & Triage Platform: this release includes a first iteration of the vision we shared in the dedicated blog article and on our stand at Offensive Con 2022. The platform monitors a directory for crash reproduction files, produced by the fuzzer of your choice. Then for each such file, it records a scenario by passing the file as input for the target binary, then it replays, analyzes and performs some initial triage of the recorded crashes. Note that the analysis is provided for Windows scenarios only so far: you will need to either fuzz directly on Windows, or to cross-compile your target binary to fuzz it on Linux and analyze crashes on Windows. Find more in the user documentation. The platform's crash analyzer is available in all REVEN Editions and can be manually run against any existing replayed scenario, while the platform's workflow itself (monitor, record, replay, analyze) is exclusive to the Enterprise Edition.
-
Fine-grained recording with WinDbg: in all editions, you can now use WinDbg to finely control a Windows scenario's VM for start and stop recording points. We recently demonstrated the capability with GDB, allowing you to make records shorter and to the point, using GDB's familiar breakpoint interface. Additionally in the WinDbg integration, you can apply breakpoints directly on function names at record time. This technology combines the QEMU Virtual Machine Introspection (VMI) technology with REVEN's OSSI. A dedicated blog article on using WinDbg and VMI to make fine-grained recordings will follow, so stay tuned! Meanwhile, you can already refer to the user documentation for the feature.
-
New "vocabulary" types for the Analysis API: up to now, most of the API would model a range of memory by accepting two parameters (start address and size) and returning tuples in the functions manipulating such objects. The
MemoryRangeconcept is often needed to keep track of the raw information (address, size) and add additional functionality on top (such as range intersection, union, concatenation, ...). This led to multiple, custom, similar implementations of the concept in users' scripts, which is indicative thatMemoryRangeis a "vocabulary" type: a type that is always implemented in a similar fashion and that is frequently useful. Providing a "canonical" implementation in the API spares users from the multiple reimplementations and makes it easier to communicate between scripts, that would previously need to convert between the various implementations of the type. This release also implements aRegisterSlicetype that allows to express that you only want a subslice of the bits of a register (for exampleeaxisrax[0:32]), andMemoryRangeMap/RegisterSliceMaptypes that store non-overlapping ranges associated with arbitrary data, very useful for some applications such as the new Taint helpers. -
More powerful Taint API: speaking of the new Taint helpers, we now provide easier ways to query what is tainted in a state, and to add or remove tainted data from a taint state. You can then restart a new Taint from the modified taint state. This simplifies the implementation of semantic tainting in the fuzzing platform, that often requires checking that some registers or memory areas are tainted, and then modify the state before restarting the Taint.
-
Windows Handle inspection: we provide a new
reven2.preview.windowsmodule that contains some Windows-specific API entries, the main one for this release being thereven2.preview.windows.Context.handleandreven2.preview.windows.Context.handlesmethods. They allow to fetch the object corresponding to each OS handle in a REVEN scenario, so that you can easily get e.g. the filename corresponding to the handle parameter in aNtReadFilecall. -
Revamped
typesAPI package, now with Windows structure information from PDBs: the API always provided a way to read from a source (register, memory) at any context, and interpret the result as some type such as signed or unsigned integers, floats, or even strings. In addition to these primitive types, this API has now been extended to support structure and enumeration types, such as the types defined by the programmers of the recorded programs. For Windows scenarios, these types are fetched from the PDBs, so that you can ask any binary executed in a REVEN scenario for any named type defined by this binary. Here is a quick example of using the newtypesAPI package to find all files created byNtCreateFilein a scenario:>>> import reven2 >>> from reven2 import types >>> # Connecting to a reven server >>> hostname = "localhost" >>> port = 13370 >>> server = reven2.RevenServer(hostname, port) >>> # Getting the first binary named "ntoskrnl.exe" in the list of executed binaries in the trace >>> ntoskrnl = next(server.ossi.executed_binaries("ntoskrnl.exe")) >>> # Getting the exact symbol "NtCreateFile" in "ntoskrnl.exe" >>> nt_create_file = next(ntoskrnl.symbols("^NtCreateFile$")) >>> # Finding all files that are created in a call to NtCreateFile >>> def read_filename(ctx) -> str: ... # The third argument to the call is an _OBJECT_ATTRIBUTES structure, the filename is stored in: ... # _OBJECT_ATTRIBUTES->ObjectName.Buffer ... ty : types.Struct = ntoskrnl.exact_type("_OBJECT_ATTRIBUTES") ... object_attribute: StructInstance = ctx.deref(reven2.arch.x64.r8, types.Pointer(ty)) ... unicode_string = object_attribute.field("ObjectName").deref_struct() ... return unicode_string.field("Buffer").deref_str( ... types.CString(encoding=types.Encoding.Utf16, max_size=unicode_string.field("Length").read_int()) ... ) ... >>> for (index, ctx) in enumerate(server.trace.search.symbol(nt_create_file)): ... if index > 5: ... break ... print("{}: {}".format(ctx, read_filename(ctx))) ... Context before #14771105: \??\C:\Windows\SystemApps\ShellExperienceHost_cw5n1h2txyewy\resources.pri Context before #14816618: \??\PhysicalDrive0 Context before #16353064: \??\C:\Users\reven\AppData\Local\...\AC\Microsoft Context before #16446049: \??\C:\Users\reven\AppData\Local\...\AC\Microsoft\Windows Context before #16698900: \??\C:\Windows\rescache\_merged\2428212390\2218571205.pri Context before #26715236: \??\C:\Windows\system32\dps.dll
Improvements
REVEN
- It is now possible to record interactions with some USB devices configured as USB passthrough.
- Linux kernel debug symbols are now correctly retrieved if the Linux kernel debug binary is present in the prepared file system. As a result of this change, the name of the executed binary corresponding to the kernel in a trace is now its actual name on disk (e.g.
/boot/vmlinuz-<kernel version>) rather thankernellike it used to be. - Searching for executed binaries in the trace is now faster when using the "Not Match" operator.
- This version improves performance of replaying the Memory History resource by about 10%.
Project Manager
- The VM's full path is now displayed when registering a new VM, to disambiguate VMs with the same name in different directories.
Axion
- When hovering over a transition in a widget, its location is displayed in timeline.
Analysis Python API
types package
- Add
reven2.types.Struct,reven2.types.Enumeration,reven2.types.UnresolvedStruct,reven2.types.UnresolvedEnumerationto model user-defined types. - Add
reven2.types.ErrorTypeandreven2.types.VoidTypethat respectively represent types that couldn't be parsed from a debug object and the void type. - Add
reven2.types.StructInstance,reven2.types.EnumerationInstance,reven2.types.ArrayInstance,reven2.types.PointerInstanceto represent values read from these types. - Add
reven2.ossi.Binary.exact_typeto get a named type from a debug object for Windows scenarios. - Add
reven2.types.F16. reven2.types.Pointernow accepts an explicitsizearguments. Pointers created this way don't have a context-dependent size.- Add
reven2.trace.Context.deref_allto explicitly ask dereferencing nested pointer types. - Add
reven2.types.Pointer.cast_innerto cast the inner type of a pointer.
Taint helpers
- You can now modify a
reven2.preview.taint.TaintStateto add or remove elements of the state, and restart a new taint from this modified state usingreven2.preview.taint.Tainter.taint_from_state.
Register slices
- Building a
reven2.RegisterSliceby indexing a register, e.g.reven2.arch.x64.rax[0:-3]is now possible. - The following items have been added:
reven2.arch.helpers.is_flag_registerandreven2.arch.helpers.is_condensed_flags_register.reven2.RegisterSliceto build bitwise slices of areven2.Register.reven2.register_slice.RegisterSliceMapandreven2.register_slice.RegisterSliceSetto store multiplereven2.RegisterSlices.reven2.Register.rootandreven2.Register.childrento retrieve the base register/children registers of a register.
reven2.preview.taint.TaintedRegisterSlicenow accepts areven2.RegisterSliceas tainted data.reven2.arch.register.Registerandreven2.arch.register.Categoryare now exposed asreven2.arch.Registerandreven2.arch.Category.
Memory ranges
- Add
reven2.MemoryRangeto model ranges of memory address. - Add
reven2.memory_range.MemoryRangeMapandreven2.memory_range.MemoryRangeSetto store multiplereven2.MemoryRange - Add memory range support to various types of the API.
OSSI
- Add support of data symbol:
reven2.ossi.Symbolis now an abstract class- Add
reven2.ossi.FunctionSymbolandreven2.ossi.DataSymbolto ossi reven2.ossi.Ossi.symbolsandreven2.ossi.Binary.symbolsreturn an iterator ofreven2.ossi.FunctionSymbolandreven2.ossi.DataSymbol- Add new methods
reven2.ossi.Binary.function_symbolsandreven2.ossi.Binary.data_symbols
- Add
reven2.ossi.BinaryMappingandreven2.ossi.OssiContext.kernel_mappingsto access to the kernel mapping at a context. - Add the
reven2.ossi.Thread.owner_processmethod to find the process owning a the current thread, when available. On Windows, threads can be detached from their owner process to execute in the context of different processes.
Python API type annotations
- Add marker file indicating that the API is typed. This results in type checkers no longer ignoring types of the API when typechecking scripts that use the API.
- Typing: Expose
reven2.address.AddressTypeto represent any address type to the type checker andreven2.address.VirtualAddressto represent virtual addresses to the type checker.
Miscellaneous
- Add
preview.windowspackage containing Windows 10 utilities (e.g to parse handles and objects) - Add string representations for classes in the
reven2.typespackage. - Classes in the
reven2.typespackage are now comparable for equality. - Made the following classes hashable:
reven2.arch.Registerreven2.trace.Contextreven2.trace.Transition- classes in the
reven2.typespackage - classes in the
reven2.addressmodule
Analysis Python API script library
- Added
examples/analyze/memory/symbols_access_memory_range.ipynbandmemory_ranges_accessed_by_a_symbol.ipynbscripts that demonstrate how to search the trace for the symbols that access a given memory range and for the memory accesses made during the execution of a symbol, respectively.
Fixed issues
REVEN
- Forward tainting
rep-prefixed instructions no longer causes overtaint in some situations. - Fixed display of operands that only consist of an absolute address in the API and in Axion.
- When running a VM, the
I/O thread spun for 1000 iterationscondition is no longer encountered. - Filters would not return a range when the last context was included in the query.
Project Manager
- Scenario deletion no longer fails with an error in some cases.
- When attempting to replay a kernel description for a Linux kernel version that is outside of the supported range, the supported range is now correctly displayed.
- In some cases, failing to download a PDB would preclude from downloading the others from the PDB server.
- VM download from a URL no longer fails in some cases
- The Light Filesystem resource is no longer marked as "not compatible" on imported scenarios (where it cannot be regenerated).
- Sometimes artifacts from older automatic records would interfere with newer automatic records during the Light Filesystem generation, leading to wrong or missing symbols.
- Replayers would sometimes output
terminate called recursivelymultiple times in the logs when failing.
Axion
- The Memory Watcher View no longer triggers the save confirmation dialog when the memory range wasn't edited/modified.
- Calltree view improvements:
- Better display of binary name
- Enable horizontal scrolling in the view
- Fix vertical scrolling when adding new items
- The Search Symbol completion no longer freezes for a long time on binaries that contain a lot of symbols.
- The Calltree view no longer requires multiple clicks to respond when clicking on sibling and level up buttons.
Analysis Python API
reven2.trace.Trace.filterwould raise an exception ifto_context == from_context + 1.- Equality comparisons of objects
reven2.ossi.Binary,reven2.ossi.BinaryMapping,reven2.ossi.Symbol,reven2.trace.Context,reven2.trace.Transitionandreven2.memhist.MemoryAccessnow all returnFalsewhen comparing against an object of a different type. Previously the behavior was unspecified. - Fixed an issue where reading a
reven2.types.Arrayof e.g. areven2.types.CString, areven2.types.Pointeror a nestedreven2.types.Arraywould return values of incorrect types. As a result of this fix, reading a value as areven2.types.Arraywill now return areven2.types.ArrayInstance.
Analysis Python API Compatibility Notes
-
The Python packages installed system-wide are no longer available in the REVEN virtual environment. This is to prevent possible conflicts between REVEN requirements and the system packages. You can install any needed Python package in the REVEN virtual environment using
pip. -
reven2.preview.taint.Tainter.simple_taintno longer attempts to convert the passed tag argument tointwhen it doesn't match any of the supported types. -
Comparing an address with another type for equality no longer raise a
ValueError, but returnsFalseinstead. -
Calling
Trace.memory_accesseswith a size of 0 now raises aValueError. -
reven2.ossi.FunctionSymbol.prototypeis deprecated. Usereven2.ossi.FunctionSymbol.demangled_nameinstead -
Since
reven2.ossi.Ossi.symbolsandreven2.ossi.Binary.symbolsnow returnreven2.ossi.DataSymbolin addition toreven2.ossi.FunctionSymbol, indiscriminately callingreven2.ossi.FunctionSymbol.name_onlyorreven2.ossi.FunctionSymbol.prototypeon its returned values may now raise an exception. If you have code like the following:>>> for symbol in binary.symbols(): >>> symbol.prototypeModify it to use the
reven2.ossi.Binary.function_symbolsfunction instead:>>> for symbol in binary.function_symbols(): >>> symbol.prototype -
Constructing a
reven2.preview.taint.TaintedRegisterSlicewith a non-positive size now raises aValueError. -
reven2.trace.Context.derefis now deprecated when the target is a type containing nested pointers. Either usereven2.trace.Context.deref_allto explicitly ask for nested-pointer dereference, or replace the inner Pointer types withUSize. In the futurereven2.trace.Context.derefwill only dereference the outermost pointer. -
reven2.trace.Context.readis now deprecated when the target is a pointer type. To compute an address, add the base address of the pointer type to the offset computed by reading as a USize. In the future,reven2.trace.Context.readwill return areven2.types.PointerInstancewhen reading a pointer. -
Reading a value as a
reven2.types.Arraywill now return areven2.types.ArrayInstancerather than alist. The former can be converted into the latter by passing it to thelistconstructor.
Upgrading from previous REVEN versions
Upgrading from REVEN<=2.7.1 to >=2.8.0
Please follow the dedicated guide, as this upgrade requires a Debian upgrade.
Upgrading from REVEN 2.x
To upgrade from a previous REVEN v2.x version, please follow the steps below.
For Docker packages
-
Stop the running REVEN Project Manager by calling the
run.shscript from the directory of the REVEN 2.x installation being upgraded. -
Extract the new Docker package to a new directory.
-
If you previously modified the
run.shscript in the existing installation, port these modifications to therun.shscript in the new directory. -
Run
run.shfrom the new directory.
For Debian packages
-
Stop the running REVEN Project Manager by calling the
stop.shscript from the directory of the REVEN 2.x installation being upgraded. -
Extract the archive to a new directory, as described in the Installation section.
-
Run
install.shas an administrator to update system dependencies. -
Upon running
start.shfor the first time, you will be provided with the choice to migrate your scenarios from your existing REVEN 2.x installations. -
If upgrading from REVEN < 2.4, you will be prompted for your license key on the first start of the Project Manager. You should have received your license key by email. If not, please contact support.
For REVEN in a VM installations
Please follow instructions detailed in the installation page.
Upgrading from REVEN v1.x
To upgrade from a REVEN v1.x version, you will need to perform a fresh installation by following the installation instructions.
Migration guide from Stretch to Buster
This guide will help you upgrade your REVEN installation, whether based on a regular archive or a Docker image, from any version running on Debian Stretch (<=2.7.1) to any version running on Debian Buster (>=2.8.0). For the sake of simplicity, it will assume and present commands for a 2.7.1 to 2.8.0 migration.
A manual operation is needed in the process because of the transition from PostgreSQL 9.6 to PostgreSQL 11.
There will be three main steps: dumping your database, upgrading your system to Buster, then restoring the database.
For non-Docker users
This section is for users that use the regular REVEN archive, not the Docker image. If you use the Docker image, chances are that you even don't run Debian Stretch in the first place, so please read the next section.
Preparing the files
Please be sure that you have the dump.sh and restore.sh scripts accessible from
the user running REVEN.
These scripts are available both from the REVEN package you downloaded (in the
tools/debian_upgrade folder of the standard package, or directly in the
debian_upgrade folder in the Docker package), or from
Github.
Dumping the database
In the procedure below, we assume that the QUASAR_ROOT folder is the default
~/Reven2. Should you have customized the QUASAR_ROOT setting, please
adapt the procedure accordingly.
IMPORTANT: These steps are to be performed before the migration while you are still running Debian Stretch and REVEN 2.7.1:
- Open a shell with the user that runs REVEN.
- Go to your 2.7.1 REVEN installation folder (the one where you extracted your 2.7.1 REVEN package to).
- Run
./start.shto start everything. - Run
./dump.sh. Check that adump-2.7.1.sqlfile was created in your~/Reven2folder. - Run
./stop.shto stop everything. - (Optional but recommended) Also make an external backup of your
~/Reven2folder, so that even if something goes wrong, you will be able to restore your data.
You can repeat those steps any time you want if you thought of some last-minute changes to your REVEN data. Just be sure to have a dump of the latest state of the database before the OS upgrade.
Upgrading your system to Buster
A comprehensive guide is provided by Debian https://wiki.debian.org/DebianUpgrade and is the most up to date and trustworthy place to find documentation on Debian upgrades.
IMPORTANT: The kvm group of your Stretch installation may cause issues
during the upgrade process. To avoid them, please delete the group before
upgrading. The group will be recreated later automatically: sudo groupdel kvm.
If you forgot this step and encounter the following error during upgrade:
The group 'kvm' already exists and is not a system group. Exiting.
simply delete the kvm group at that moment, and run sudo apt install -f to
let apt configure the failed packages, then continue the upgrade procedure as
usual.
Restoring the database
These steps are performed after the migration while you are now running Debian Buster and REVEN 2.8.0.
In the procedure below, we assume that the QUASAR_ROOT folder is the default
~/Reven2. Should you have customized the QUASAR_ROOT setting, please
adapt the procedure accordingly.
- Open a shell with the user that runs REVEN.
- Go to your REVEN installation folder.
- Run
./install.shto ensure all the system dependencies are installed. - Run
./start.sha first time. - If you need to restore parameters into the
settings.pyconfiguration file, now is the right time to do it. - Now we need to get the right data at the right place, including the database
to migrate. The easiest way to do that is to attempt to start REVEN, which
will end with an expected failure since the database was not restored
yet.
Run./start.sha second time.
Use the script interface to migrate your old data to the new REVEN version. - The previous step should leave you with an error message that looks like the
following:
The part you are interested in is after theA process (postgres) failed to start (cmd: '/usr/lib/postgresql/11/bin/postgres -D /home/<user>/Reven2/2.8.0/db-2.8.0.psql -k /tmp/tetrane-1000 -p 37221')-Dargument. This is the path to your PostgreSQL database that needs migration. - Run the following, of course adapting the
<user>part to your situation:./restore.sh /home/<user>/Reven2/2.8.0/db-2.8.0.psql /home/<user>/Reven2/dump-2.7.1.sql - Finally, run
./start.shone last time. As you have already handled the migration in step (6), you need to keep using your existing data, so answernowhen the script asks if it should overwrite the data directory.
The REVEN Project Manager is now up and running. Enjoy!
If you made any mistake during one of these steps, don't panic. You can repeat them over and over, until you have restored the right database in your REVEN Project Manager.
For Docker users
This section is for users that use the REVEN Docker image. If you don't run REVEN through Docker, please read the previous section.
Preparing the files
Please be sure that you have the dump.sh and restore.sh migration scripts
accessible from the user running REVEN. These scripts are available in the
debian_upgrade folder in the Docker package, or from
Github.
As the user running REVEN is inside the running container, the best place for
you to put the dump.sh and restore.sh migration scripts is probably your
REVEN2_PATH that defaults to ~/Reven2 on your host.
Inside the container, the REVEN2_PATH will be accessible in the /Reven2
directory and the REVEN installation folder in /reven.
Dumping the database
These steps are performed using the Stretch-based REVEN container (<=2.7.1).
- Ensure your REVEN container is running:
./run.sh. - Get a shell inside the running container:
docker exec -it <username>-reven su reven - Make the dump:
/Reven2/dump.sh - Exit the container:
exit - Stop the container:
./run.sh
You should now have a dump-2.7.1.sql file in your ~/Reven2 directory.
You can repeat those steps any time you want if you thought of some last-minute changes to your REVEN data. Just be sure to have a dump of the latest state of the database before the REVEN upgrade.
Upgrading your REVEN version
Just as usual, download a REVEN 2.8.0 Docker package and extract it in the
directory of your choice, for example using tar xvf <package>.
Restoring the database
These steps are performed after the extraction of the REVEN 2.8.0 Docker package.
In the procedure below, we assume that the REVEN2_PATH folder defined in
the run.sh script is the default ~/Reven2. Should you have
customized the REVEN2_PATH setting, please adapt the procedure accordingly.
- We first need to get the right data at the right place, including the
database to migrate. The easiest way to do that is to attempt to start the
REVEN container.
This will end with an expected failure since the database was not restored yet.
Run./run.sha first time.
Use the script interface to migrate your old data to the new REVEN version. - The previous step should leave you with an error message that looks like the
following:
The part you are interested in is after theA process (postgres) failed to start (cmd: '/usr/lib/postgresql/11/bin/postgres -D /Reven2/2.8.0/db-2.8.0.psql -k /tmp/tetrane-1000 -p 37221')-Dargument. This is the path to your PostgreSQL database that needs migration. - Stop the container:
./run.sh. - Run a temporary container to perform the migration:
docker run -it --rm --entrypoint bash -v ~/Reven2:/Reven2 tetrane/reven2:2.8.0-enterprise -c 'su reven'
Of course, adapt the Docker image name (tetrane/reven2:2.8.0-enterprise) to the one you are using.- Run the restore process:
/Reven2/restore.sh /Reven2/2.8.0/db-2.8.0.psql /Reven2/dump-2.7.1.sql - You can now close the temporary container:
exit.
- Run the restore process:
- Run a final
./run.sh.
The REVEN Project Manager is now up and running. Enjoy!
If you made any mistake during one of these steps, don't panic. You can repeat them over and over, until you have restored the right database in your REVEN Project Manager.
Known issues and limitations
These are items we want to let you know about:
-
Symbol information being swapped to disk prevents OSSI resolution:: In some cases, memory pages required by REVEN to resolve the OSSI are swapped to disk before a scenario is recorded, which leads to missing information about some modules (e.g.
ntoskrnl.exe) in the replayed scenario. To mitigate this issue you can create VMs with more RAM so that swap is less used. -
The Axion layout is not fully saved: When starting Axion after an upgrade, changes made to the size of the left and right columns of widgets may not be saved. If this happens, then remove the
$HOME/.config/tetrane/reven2.conffile. The layout will be reset to default on the next Axion startup and changes will be saved as expected on future launches of Axion. -
In case Axion is unresponsive on some scenarios, try to delete the strings resource and restart the REVEN server on this scenario.
-
Only a single taint can run concurrently per REVEN scenario: currently, starting a second taint, even from a different Axion or the Python API, will cancel the first running taint. Besides, if two clients (such as two Axion sessions) are involved, the first client may display mixed taint results.
-
When using the auto-record functionality, the replay operation may fail at the start of the trace with the following error:
detect_infinite_loops: Assertion 'false' failed. Performing a new scenario recording usually fixes the issue.
Previous versions
In this section, you can find the changes to previous versions of REVEN:
- 2.10.2
- 2.10.1
- 2.10.0
- 2.9.0
- 2.8.2
- 2.8.1
- 2.8.0
- 2.7.1
- 2.7.0
- 2.6.0
- 2.5.0
- 2.4.0
- 2.3.0
- 2.2.1
- 2.2.0
- 2.1.0-beta
- 2.0.2
- 2.0.1
- 2.0.0
2.10.2
REVEN 2.10.2 contains some improvements and bugfixes. Upgrade from REVEN 2.10.1 and 2.10.0 is recommended.
- If upgrading from 2.9.0 or earlier, it is mandatory to read the release notes for version 2.10.0.
- If upgrading from 2.10.0 or earlier, it is recommended to read the release notes for version 2.10.1.
- If upgrading from 2.8.1 or earlier, it is recommended to read the release notes for version 2.9.0.
Improvements
Project Manager
- The Prepare Task now fails with an informative error if the detected OS or architecture are different from the values configured in the VM property screen. Wrong configured values do create issues when generating or using the Kernel Description.
Python API
- The
OssiContext.threadmethod allows to retrieve the currently running thread at a given context.
Fixed issues
Axion
- The Taint view no longer slows Axion down when a taint result contains many changes. As a result of this improvement, the view has changed, please refer to its documentation for information on the new view.
- The Calltree view would sometimes display "Waiting..." until the user interacts with the view (e.g. hovering or clicking a line) instead of refreshing the binary or symbol name as soon as it become available.
- When the Fast Search feature is not available (because its resources have not been replayed), the default Search view is no longer inconsistent and no longer displays an "Error: Binary field cannot be empty" message.
2.10.1
REVEN 2.10.1 sees the release of the Free Edition, and contains some improvements and bugfixes. Upgrade from REVEN 2.10.0 is recommended.
- If upgrading from 2.9.0 or earlier, it is mandatory to read the release notes for version 2.10.0.
- If upgrading from 2.8.1 or earlier, it is recommended to read the release notes for version 2.9.0.
Improvements
Axion
- The current thread ID is displayed in the status bar in Windows and Linux scenarios.
- A new Prototype Widget is available that allows to resolve a symbol call's parameters and return value.
Analysis Python API
- The new REVEN API Cookbook can be found on GitHub or inside the package.
- The new
Type.to_bytesmethod allows to convert a value of a type to its byte representation.
Fixed issues
REVEN
- The symbol resolution from an ELF binary in a Linux scenario is now more complete and no longer exhibits incorrect RVA.
Project Manager
- The VM Wizard now displays progress when converting a VM and no longer prevents from going to the next step after conversion has ended.
- The error messages explaining why a step isn't available for a scenario in the scenario list are now easier to discover.
Axion
- The binary completion list is now correctly displayed in the KDE desktop environment.
WinDbg integration
- The bridge no longer crashes when a debugging command (such as
g) is attempted without having replayed the necessary resources for that scenario. - The bridge no longer loops infinitely when a debugging command (such as
g) is attempted with WinDbg version 2111. - The bridge no longer returns wrong instruction data for the current instruction when a breakpoint is hit on a 32-bit scenario.
2.10.0
Highlights
REVEN version 2.10 is packed with new features, with the following highlights:
- Improved UX for newcomers with a step-by-step installation and quick start guide, and several UI pitfalls rubbed out.
- Improved performance on the Analysis side, with scripts such as
detect_use_after_free.ipynbrunning up to 8 times faster. - A new API to iterate on contexts inside a process or a ring.
- A new API to inspect prototypes of functions and read parameters and return value.
- New OSSI for Linux CentOs 8 and enhanced OSSI for mangled symbols and Windows 21H1.
In more details:
- Fast path from downloading REVEN to the analysis of your first scenario: Using REVEN is easier than ever, thanks to many improvements to the setup process and documentation. We changed the default options to be more convenient and push first-time users towards the fast path. The revamped Installation section and the brand new Quick start guide will guide you through the installation and first use of REVEN, from the moment you download your package to the analysis of your first scenario!
- Process/Ring filters API: The new
Trace.filtermethod allows to iterate on contexts that match a specific set of processes, and/or rings. This easily enables a common use-case of analyzing only some processes in userspace (e.g. only look at the instructions executed while running Chrome). - Preview Prototype API: The Prototype API is what has been powering our
ltraceandfile-activityreport scripts since their release in 2.6 and 2.7. This API is now exposed as apreview.prototypespackage, that allows to parse C headers to return their signature, and also expose ABI call convention so that you can easily read e.g. the value of the third argument or return value of a call. Refer to the documentation of that package for more information. - Faster analysis: A new optional resource (replayed by default) called the
Executed blocks, allows to iterate on transition objects faster, yielding performance improvements for the replay of some resources and the analyses that depend on iterating on transitions. Concretely, we observe speedups of x5 for sequential instruction recovery and up to x100 for random access of transitions. For end-user scripts such asdetect_user_after_free.ipynbthis translates to a speedup of up to x8. - More complete and customizable symbol demangling: Axion now displays in most places a shorter form of the demangled symbols. The full signature is available at the call of a symbol or on demand. Meanwhile, the symbol API sees the addition of three new entries:
Symbol.source_name,Symbol.name_onlyandSymbol.prototypethat are geared to recovering mangled and demangled symbol names in their short or long form. - More OSSI (current process, binary, symbol) support:
- On the Windows front, REVEN 2.10 better supports the latest released version of Windows 10 (21H1).
- REVEN now supports resolving the OSSI for the CentOS 8 distribution.
Improvements
REVEN
- Taint performance optimization, with up to 66% speedup in workloads with many pieces of tainted memory.
Project Manager
- For new installations, the list of PDB servers are now pre-populated with common PDB servers. For existing installations, you can refer to the documentation if you want to add the new PDB servers.
- Virtual Machines (VMs) in the
qcowformat are now automatically converted to theqcow2format during the VM registration wizard. - The error message when there is a timeout during a binary autorecord is now clearer.
- Now, by default, all resources are selected to be replayed in the Replay page of a scenario as this is a most common use case.
- The Axion GUI client and the VM displays are now being rendered by default from the Project Manager's web interface, in your browser. To configure another behavior, please refer to the documentation.
- The logs of the services of the Project Manager (Postgres, Redis, Celerdy, uWSGI, etc.) are now rotated, to avoid accidental destruction of log information when restarting the Project Manager.
Analysis Python API
- In a Jupyter Notebook, a
reven2.address.LinearAddress,reven2.address.LogicalAddressorreven2.address.LogicalAddressSegmentIndexinstance now displays as a clickable link that instructs Axion to open a hexdump widget at that address. - The
Sessions.publish_addressmethod allows to publish an address to synchronized clients like Axion. - The
Ossi.executed_processesmethod allows to get the processes executed in a Windows scenario. - The
Transition.pcandTransition.modeproperties allow to query the RIP and CPU mode associated with a transition.
Analysis Python API script library
- The new script
automatic-post-fuzzer-recorder.pythat was demonstrated in a recent article has been added to the examples in the package. threadsync.pyadds an option to filter by the synchronization primitive, and replace the--cr3option with a--pidoption for ease of use and consistency with other scripts.detect_data_race.ipynbsees improved performance for workloads with many accessed memory address. The output of the notebook has been tuned to better distinguish between undetermined and positive cases.export_bookmarks.ipynbnow supports exporting bookmarks even when the OSSI is not available, but emits a warning in that case.bk2bp.ipynbnow correctly reports its dependency to the OSSI.ltraceandfile-activitynow use the providedpreview.prototypesAPI.
Fixed issues
REVEN
- OSSI: For Windows scenario, the MMU can now read standby pages in memory, solving an issue where certains modules could not be loaded.
- Some interrupts would mistakenly report that they would occur while executing an instruction when it wasn't the case. This issue is fixed for scenarios with the
Executed Blocksresource replayed. - The stack event and PC range replay would fail with
Error: Cannot disassemble empty datawhen encountering an instruction with empty data. - The server would crash when tainting through an instruction with empty or wrong data.
Project Manager
- A VM or its snapshots can no longer be used to record a scenario or be selected in the VM list while it is being registered in the Wizard.
- The Project Manager no longer blocks the user from registering new VMs when a VM or snapshot is unexpectedly deleted during registration.
Axion
- A sporadic segmentation fault crash in the Calltree view has been fixed.
- The calltree no longer crashes after disconnecting from a project and reconnecting to a different project in Axion.
- The calltree no longer sporadically logs an error reading "impossible case".
Analysis Python API Compatibility Notes
- The following deprecated classes and methods have been removed:
- The
Stack.backtracemethod and theBackTraceclass: print directly theStackobject to display a backtrace. - The
Taint.changesmethod and theTaintChangesandTaintChangeViewclasses: use theTaint.accesses(changes_only=True)to get the changes of the taint.
- The
- The return value of
Symbol.namechanged: previously it would return the prototype, now it returns the short name (Symbol.name_only) of a symbol if available, or otherwise defaults to the source name (Symbol.source_name).
2.9.0
Highlights
REVEN version 2.9 is packed with new features, with a focus on providing the users with more trace navigation and memory analysis handles in the Axion GUI.
Here are some highlights:
-
Memory Watchers in Axion GUI: The GUI now allows to create Memory Watchers, that will display the value of a range of memory at all times while browsing a REVEN scenario.
-
Markers of a transition's location in the trace: To make it easier to tell at a glance where a particular transition falls in the scenario, hovering a transition in any widget now displays its position in the time. Moreover, the transitions displayed in widgets now sport an icon indicating their position relative to the currently selected transition.
-
Debugger controls with step out and step over navigation in Axion GUI:
Step out/Step overbuttons and their corresponding shortcuts allow to quickly find the exit of a function, or to skip over a call in a single action. Due to REVEN's timeless nature, it is of course possible to step out/step over backward. -
Step out and step over are also available in the Python API: The new methods
Transition.step_outandTransition.step_overbring this capability to the API where it can be used for automation. For example,step_outallows to easily find the return value of a function you're in. -
New sample scripts and notebooks:
detect_data_race.ipynb: demonstrates how to use the API to detect data races in programs whose synchronization would depend on critical sections.threadsync.py: traces calls to Windows synchronization APIs such asEnterCriticalSection,WakeConditionVariableorReleaseMutex.export_bookmarks.ipynbandbk2bp.ipynb: demonstrates how to use the bookmark API to generate a report in HTML or markdown or to generate breakpoints that can be imported into WinDbg.- All sample scripts can now be browsed in the documentation.
Improvements
REVEN
- High-level OS Specific Information (OSSI) has been enhanced:
- In Windows scenarios, REVEN now presents private symbols from PDBs, as well as symbols from PDB modules. Besides, the performance of PDB parsing has been improved by up to 400%, which translates in a shorter waiting time when loading transitions for the first time in the trace in Axion GUI or the Python API.
- In Linux scenarios, REVEN now loads symbols from debug binaries if available at the standard locations looked up by GDB (such as
/usr/lib/debug).
Project Manager
- In Linux scenarios, the debug binaries are now extracted when replaying the Light Filesystem resource.
Analysis Python API
- The
reven2.Trace.memory_accessesmethod now supports fetching memory accesses on the entire trace or on a range of transitions regardless of the address of the memory access. Concretely, this means that theaddressandsizeparameters of this method are now optional.
Axion
- The Calltree view now displays bookmark icons next to entries corresponding to a bookmarked transition.
- Hexdump views can now be renamed so that their identification is easier during the analysis. To rename a Hexdump, right-click on it, then choose "rename".
- You can now select which Hexdump view is "active" by clicking the corresponding button in the widget. The active Hexdump is the one which is used when a new address is selected for display. If no Hexdump is active, selecting an address will display it in a new one.
- Shortcut management:
- Shortcut conflicts are now displayed in the shortcut editor.
- A modal dialog now warns user upon inputting a shortcut that is associated to multiple actions.
- Axion no longer saves or loads shortcuts that are the same as the default in the settings. This reduces the probability of a shortcut conflict when upgrading Axion.
Fixed issues
REVEN
- The taint now propagates correctly through the
bswapinstruction.
Project Manager
- Compressed Linux kernel modules files were not copied during the light filesystem extraction of a scenario.
Axion
- Calltree view: The binary name for the root node of the calltree was sometimes mistakenly reported as
unknown. - Calltree view: The current transition display (red line) is now displayed at the correct location in the following situations:
- when the children of the last call node also have children nodes,
- when the calltree view has been "locked" by clicking the lock button.
- Closing Axion with a
SIGINTorSIGTERMsignal is now considered like a normal exit. This allows in particular to save Axion's settings when an Axion session is stopped from the Project Manager.
Analysis Python API
- Some calls to the
preview.project_managerAPI could spuriously fail with aConnectionError, especially when using a high-latency connection. - Python dependencies of example scripts are now distributed along
reven2, which makes use of these scripts easier, especially in air-gapped networks.
Analysis Python API Compatibility Notes
- The
Stack.backtracemethod and theBackTraceclass have been deprecated and are scheduled for removal in version 2.10. Usestrordisplayon aStackinstance to display a backtrace.
2.8.2
REVEN 2.8.2 is a bugfix release. Upgrading from REVEN 2.8.1 is recommended.
- If upgrading from 2.7.1 or earlier, it is mandatory to read the release notes for version 2.8.0.
- If upgrading from 2.6.0 or earlier, it is recommended to read the release notes for version 2.7.0.
Fixed issues
Axion GUI
- In the Calltree view, the current transition indicator displayed as a red horizontal line could be wrong when folding the oldest parent.
- The Calltree view could cause unnecessary CPU usage.
- In the tutorial, Next/Prev buttons would not work in some cases.
Strings
- In the Strings resource, some strings could contain garbage characters.
Analysis of Linux systems
- The Framebuffer view could be wrong for some Linux scenarios recorded in graphical mode (X or Wayland server...).
- Symbols could be wrong for binaries whose lowest LOAD section was not executable.
- Kernel description generation would fail in some cases, leading to unavailable OSSI information.
2.8.1
REVEN 2.8.1 is a bugfix release. Upgrade from REVEN 2.8.0 is recommended.
- If upgrading from 2.7.1 or earlier, it is mandatory to read the release notes for version 2.8.0.
- If upgrading from 2.6.0 or earlier, it is recommended to read the release notes for version 2.7.0.
Fixed issues
- In REVEN v2.8.0, disassembled instructions were displayed without prefix(es) in Axion and the Python API.
2.8.0
Highlights
REVEN version 2.8 is packed with new features, still with a strong focus on providing you with a "bird's eye view" over a trace, so that you can get important information about what happens in a scenario at a glance! Here are some highlights:
-
Call Tree view in Axion GUI: the GUI now proposes a new Call Tree view that provides users with far more semantic information about what is going on in the trace. Navigate to one transition and immediately visualize the call history before and after this transition, from there jump to surrounding points of interests.
-
New vulnerability detection notebooks: new Jupyter Notebooks are available to help you detect Buffer Overflow vulnerabilities and Uninitialized Memory vulnerabilities. The notebooks are available in the "Python API - Analyze" examples of the "Download" page of the Project Manager, as well as on our GitHub.
Important Compatibility Notes
-
REVEN version 2.8 is the first version of REVEN to support Debian Buster and Python 3.7. As a result, support for Debian Stretch and Python 2.7 has been removed. See the migration guide for more information on the upgrade process.
-
REVEN version 2.8 switches from Capstone to Zydis as its disassembler backend. This modifies the result of the
reven2.trace.Instruction.mnemonicand thereven2.trace.Instruction.operandsmethods, as well as the display of some instructions in Axion.For example, the instruction
xmmword ptr [rdi + rcx]is now rendered asxmmword ptr [rdi+rcx*1], the instructionrep movsq qword ptr [rdi], qword ptr [rsi]is now rendered asrep movsq(the operands are implicit), or the instructioncmpltps xmm1, xmm0is now rendered ascmpps xmm1, xmm0, 0x1(fixing the mnemonic and the operands). -
The behavior of the
Tainter.simple_taintandTaintResultView.filter_by_context_rangefunctions has been modified in the way theto_contextparameter is handled. Previously, the taint would not propagate through theTransitionright before theto_contextparameter. With this change, it is now the case. This means that a simple taint between contextcand contextc + 1will now propagate through the transition between contextcand its successor context, whereas before it would propagate through no context at all.
Improvements
REVEN
- Taint performance has been improved up to x4 in some workloads (long taint with lots of tainted memory benefit most from the improvement)
- In the Python API
Taint.accessesslicer, more instructions are reported as "accessed":- When the conditional flag is tainted in a conditional move or jump
- When a tainted register is used to dereference memory
- Changed REVEN's disassembler backend from Capstone to Zydis, yielding runtime improvements in performance and correctness.
- In the Enterprise edition, it is now possible to start and stop recording using the ASM stub, even when performing an automatic binary record. This allows for more flexiblity in the record options.
Analysis Python API
- The accuracy of the
Transition.find_inversemethod has been improved so that it returns the correct transition in more cases. - Added an example script
thread_id.pyto detect the current thread and find the transition where it was created. You can find it in theDownloadpage of the Project Manager. - The standalone Python API Debian package is now easier to use with the addition of a
sourcemescript. Please refer to the installation documentation for more information.
Axion
- The Backtrace view now skips "trampoline" calls by default. Trampoline calls are calls that immediately call another function selected dynamically by an indirect jump. It is desirable to skip them, since they muddle the backtrace and don't add any useful information.
- The accuracy of the "%" (find inverse) plugin has been improved so that it jumps to the correct transition in more cases.
- You can now choose the numeric base in which to display the register values in the CPU view.
- Displaying symbols in the Taint view is now optional.
VirtualBox
- VirtualBox is now shipped in version to 6.1.18, which brings all the benefits of VirtualBox 6 to REVEN, such as the major rework of the user interface and the support of host Linux kernels up to version 5.10. QEMU remains the recommended way to record scenarios for most usages.
Fixed issues
Analysis Python API
TaintResultView.filter_by_context_rangewould raise anAttributeErrorwhen theto_contextparameter wasNone.- The provided
automatic-scenario-creation.pyexample no longer fails attempting to replay the deprecatedbinary_rangesresource. Context.find_register_changecould loop infinitely when invoked in backward.Context.find_register_changecould skip changes depending on the value of the technicalfetch_countparameter.Context.find_register_changewould mistakenly raiseAttributeErrorwhen itsto_contextparameter wasNone.
Project Manager
- When recording a QEMU VM with UEFI enabled, the UEFI boot option is now passed correctly when replaying.
- External processes launched by the Project Manager are correctly terminated by clicking the various
Stop sessionbuttons. - It was not possible to use OSSI without the kernel description and light filesystem resources. The snapshot filesystem can now be used if the light filesystem is not available.
- The Project Manager would sometimes fail to correctly terminate its subprocesses. This would lead to some zombie processes remaining on the server running the Project Manager, and in some cases would lead to a failure to stop a VM when clicking the "Stop VM" button.
- A superfluous and misleading error was displayed when attempting to replay without being able to delete all the necessary resources.
2.7.1
REVEN 2.7.1 is a bugfix release. Upgrade from REVEN 2.7.0 is recommended.
If upgrading from 2.6.0 or earlier, it is recommended to read the release notes for version 2.7.0.
Fixed issues
- The taint would sometimes crash when run backward. In Axion, the crash could manifest with taint results being unexpectedly cut short, and sometimes all the changes reported in the taint would be prefixed by a warning sign.
- Axion would sometimes crash while browsing the trace with some text selected in the Trace view.
- Creating a live snapshot for a VM with more than 4GB of RAM would sometimes freeze the VM and never end, growing the snapshot file on disk indefinitely.
- Wrong symbols could sometimes be displayed when disconnecting Axion and reconnecting it to another project.
Future compatibility notes
-
Debian 9 (Stretch) is getting old. To provide you with recent software and improve our development process, please note that REVEN 2.7.x versions are the last versions that will run on Debian 9 (Stretch). If you are using the Debian archive of REVEN, you will need to upgrade to a new Debian version to install REVEN 2.8 or superior.
-
Please note that REVEN 2.7.x versions are the last versions that support Python 2.7, which has reached End-of-Life in 2020. Future versions of REVEN will only support Python 3.7 and superior.
Limitations and known issues
- When recording a QEMU VM with UEFI enabled, the UEFI boot option is not passed when replaying.
As a workaround, add
-bios /usr/share/ovmf/OVMF.fdto the replay options when replaying a scenario recorded with a UEFI-enabled VM.
2.7.0
Highlights
REVEN version 2.7 is packed with new features, with a strong focus on providing you with a "bird's eye view" over a trace, so that you can get important information about what happens in a scenario at a glance! Here are some highlights:
-
Filter Widget in Axion: the Axion GUI now proposes a new Filter Widget, that allows you to see at a glance which processes are present in the trace, and specify which ones are of interest to you, as well as which rings you would like to see (user, kernel, or both). The Trace view then reflects which ranges of transitions belong to the specified filter, and allows to browse between these ranges by skipping the filtered out transitions. Please refer to the documentation for more details on filters.
-
Use-after-Free vulnerability detection notebook: this Jupyter Notebook leverages the taint API of REVEN to search for potential Use-after-Free vulnerabilities in a REVEN scenario recorded on a Windows x64 machine. The notebook can be configured to only search for vulnerabilities in some processes/binaries of the trace so as to maximize performance. By default, the notebook supports the user
mallocand the systemExAllocatePoolWithTagallocators, but you can modify the notebook to add more! The notebook is available in the "Python API - Analyze" examples of the "Download" page of the Project Manager, as well as on our GitHub -
File activity report tool: this tool reports the file operations, such as creation, opening, reads and writes, that occur in a REVEN scenario recorded on a Windows x64 machine. The tool is available on our GitHub.
-
Crash quick report tool: this tool detects and reports system crashes and user exceptions that occur in a REVEN scenario. The tool is available in the "Python API - Analyze" examples of the "Download" page of the Project Manager, as well as on our GitHub.
-
ASM stub automatic recording from the Project Manager (Enterprise Edition): you can now automatically start and stop a record when the guest VM executes a specific instruction, directly from the Record page of the Project Manager. For more information about ASM stub recording, please refer to the documentation.
-
Improved Linux OSSI support: for kernels in the supported version range (versions 4.1 to 4.14.9), the OSSI are now automatically generated for 64-bit Linux VMs. This allows you to access e.g. the kernel symbols more easily in a Linux scenario. Please refer to the documentation for more details on OSSI for Linux. Note that process filtering is not available on Linux scenarios at the moment, and due to the way dynamic symbols are called in Linux, the backtrace widget may provide less useful information.
This version introduces changes that will make it necessary to regenerate some resources in order to benefit from all REVEN features in your scenarios. See compatibility information for more information before upgrading.
Improvements
Analysis Python API
- Added the
reven2.RevenServer.scenario_nameto get the name of the current scenario from the API. - The
dump_pcap.pyscript now reports in its standard output the address in memory of each packet.
Project Manager
- Configuring QEMU VMs with 3GB of RAM and more is available in Beta Testing and may still be unstable.
- Preparing a VM snapshot by extracting its filesystem now requires much less space during the process (from 3x the space of the extracted filesystem to as low as 1x), incurs less stress on the I/O, which makes the machine more usable during the process, and also requires less space on disk after extraction. Due to this change, it is required to prepare anew all of your snapshots to benefit from the OSSI in the associated scenarios. See compatibility information for more information before upgrading.
- In the Enterprise Edition, you can now update the outdated resources and clean the deprecated ones in a single click
with the new
Updatebutton that is available next to each scenario in the scenario list of the Project Manager. - You can now access the notebooks of a scenario with a new link in the scenario's description page. Besides, all the notebooks can be accessed with a new link in the footer of each Project Manager page.
Axion
- The Taint widget now displays the symbol corresponding to the transition at which each taint change is performed.
WinDbg integration
- Axion can now be synchronized with WinDbg, so that whenever WinDbg requests a new transition with a debugging command, the same transition is selected in Axion
Fixed issues
REVEN
- The taint would sometimes assign the wrong memory address to a tainted address in basic blocks of instructions when
the block contained
and memory, 0instructions or similar instructions with a "memory desynchronization" warning.
Analysis Python API
TaintAccess.state_beforeandTaintAccess.state_afterwould sometimes raise aStopIterationexception.- Multiple calls to
Taint.simple_taintwould mistakenly share the same taint data.
Project Manager
- It is now possible to upload a VM from disk when running REVEN in a Docker container.
- It is no longer possible to delete resources of a scenario while the corresponding REVEN server is running.
- QEMU not responding would sometimes cause an error on some pages when interacting with a VM.
- When exporting PDBs during a scenario export, PDBs of the CDROM files will be exported too as long as they are in the SYMSTORE.
- Imported resources now correctly report a progress of 100%.
- Attempting to delete a non-existing resource does not cause an error anymore.
- The light filesystem used to be incomplete for Linux scenarios, which could lead to less symbols in imported scenarios.
Axion
- The "prev"/"next" links now display the symbol of the previous/next backtrace switch rather than the symbol of the current transition.
- The status bar is now correctly cleared when the user disconnects from a project.
Future compatibility notes
-
Debian 9 (Stretch) is getting old. To provide you with recent software and improve our development process, please note that this REVEN 2.7 version is the last version that will run on Debian 9 (Stretch). If you are using the Debian archive of REVEN, you will need to upgrade to a new Debian version to install REVEN 2.8 or superior.
-
Please note that this REVEN 2.7 version is the last version that supports Python 2.7, which has reached End-of-Life in 2020. Future versions of REVEN will only support Python 3.7 and superior.
Limitations and known issues
- When recording a QEMU VM with UEFI enabled, the UEFI boot option is not passed when replaying.
As a workaround, add
-bios /usr/share/ovmf/OVMF.fdto the replay options when replaying a scenario recorded with a UEFI-enabled VM.
2.6.0
Highlights
REVEN version 2.6 is packed with new features, from GUI and workflow improvements to ever better third party integration! Here are some highlights:
-
Whole trace search in memory: The new
trace.search.memoryAPI entry allows to look for arbitrary patterns of bytes in the memory accessed throughout the entire trace. -
The WinDbg integration now supports stepping commands, setting breakpoints and going to the next breakpoint: This allows you to use even more of your usual WinDbg workflows with REVEN, and in particular significantly improves how you can browse the REVEN trace from WinDbg. This changes a bit how you can use the integration. Please refer to the documentation for more details.
-
The Taint in the Analysis API now returns the instructions that use tainted data: Before version 2.6, only the instructions that changed which data was tainted could be queried. With this new feature, you can now extract a shorter program, containing only the instructions that are relevant to the tainted data, allowing the taint to act as a slicer. Use the
Taint.accessesmethod to get the list of the instructions that use tainted data. -
A new "ltrace-like" tool is available: for a given binary in a trace, it allows to see all the calls to functions of external binaries, complete with their parameters and return types (when they are known to the system, such as functions documented on the MSDN). Users can also add their own signature to the system for the calls to be recognized. You can find this tool on our Github.
-
Automatic binary recording from the Project Manager (Enterprise Edition): you can now automatically start a record when a binary starts executing, directly from the Record page of the Project Manager. The record stops automatically when the binary either exits or crashes (or if the VM itself crashes). For both Enterprise and Professional editions, the Record page was revamped for the occasion and sports a more reactive and complete interface that includes the improvements introduced by the VM Creation Wizard in version 2.5.0.
Improvements
REVEN
- REVEN can now be used behind a proxy for contacting the license server (Professional Edition), downloading symbols from a symbol server and downloading VMs in the VM wizard. Please refer to the installation documentation for more details.
Analysis Python API
- Add
Context.search_in_memorymethod to perform a search in the virtual memory at a single context. This is the API entry corresponding to thesearch_in_memory.pyscript introduced in version 2.5.0. - Add various helper methods to get the first and last context and transition in a trace.
Axion
- The Bookmark widget now displays the symbol corresponding to the transition at which the bookmark was set.
- Improved reactivity of the Backtrace widget when there are many backtrace items.
- Improved the Hexdump widget:
- The default block size in the Hexdump widget now depends on the current mode: QWORD when in 64-bit, DWORD when in 32-bit.
- The Hexdump widget now keeps the scroll position and current selection when going back and forth in history.
- You can now optionally select with which segment you wish to follow an address from the Hexdump and CPU widgets.
Fixed issues
REVEN
- The QEMU emulator and the PANDA recorder/replayer components have been upgraded. This upgrade fixes some possible segmentation faults while replaying the trace. Note that scenarios recorded with version 2.6 cannot be replayed with an older version of REVEN.
- Interrupts could sometimes be replayed at the wrong time in the trace. The fix changes the transition numbers in replayed traces. See compatibility information for more information.
- The taint would sometimes incorrectly taint
raxonxor eax, eaxinstructions. - When using the docker installation method of REVEN, it is now possible to install both the Professional and the Enterprise editions on the same machine.
Analysis Python API
RegisterSlicenow correctly takes the requested slice of the register when the first item is 0 or the last item is the size of the register.TaintView.take_nwould sometimes not return the requested number of results.
Project Manager
- Opening Python from the Project Manager is now more reliable and less impacted by browser blocking pop-ups.
- "Prepare VM" uses a temporary directory for more atomic filesystem operations while extracting the file system.
Axion
- The status bar at the bottom of Axion is no longer displayed when the user disables the corresponding option in the "Windows" menu.
WinDbg integration
- WinDbg's built-in search in memory was not working properly and has been disabled for the time being.
- Improved logging in case of a connection error.
2.5.0
Highlights
REVEN version 2.5 is packed with new features, from GUI and workflow improvements to ever better third party integration! Here are some highlights:
-
Microsoft WinDbg integration: the REVEN server can now act as a Windows machine being debugged by WinDbg. This allows to use the usual debugging commands with REVEN and to get the best of both Windbg debugging and REVEN timeless analysis.
-
Zoomable timeline in Axion: it provides a zoomed view of the main timeline, making it much easier to distinguish between several close search results or bookmarks.
-
New VM installation workflow: a new wizard will guide you through the necessary steps for adding a VM, in particular making it "lighter" for REVEN scenario recording.
-
Improved hexdump management: the hexdump widget is now reused by default when following a memory address, to avoid "hexdump proliferation". The hexdump style has also been reworked for improved clarity.
-
Python API/Axion synchronization: it is now possible to instruct Axion to select a transition from the Analysis Python API.
-
Jupyter Notebook integration: REVEN 2.5 now includes a Jupyter notebook server so that you can easily use the REVEN Analysis Python API on a given scenario from the Project Manager.
-
Server-side bookmarks management: the bookmarks of a scenario are now saved live with the scenario data and exported automatically when exporting a scenario.
Besides, bookmarks are automatically synchronized between Axion clients, making it easy to share key points of interest with other users if you're using REVEN Enterprise.
Improvements
Analysis Python API
- Added
bookmarkmodule that allows to programmatically add, access, edit and remove bookmarks. - Added
address.LinearAddress.translate,address.LogicalAddress.translate,address.LogicalAddressSegmentIndex.translateto translate virtual addresses intoaddress.PhysicalAddress. - Added
trace.Transition.find_inversemethod to get the transition that performs theinverseoperation of the given transition. This feature was previously provided by thepercent.pyscript. - Added
trace.Context.find_register_changemethod to find the next/previous context at which the content of the requested register is modified. - Added
sessionmodule that allows to publish various events to clients like Axion. - Added
RevenServer.sessionsproperty that lists the sessions tracked by theRevenServer. RevenServerandRevenServer.connectnow accept an additional keyword parameter 'sessions'. to set the tracked sessions- In Jupyter Notebook, a
reven2.trace.Transitioninstance now displays as a clickable link that instructs Axion to select that transition in Jupyter Notebook. - Added a
search_in_memory.pyexample script to search patterns in virtual memory. You can find it in theDownloadpage of the Project Manager.
Project Manager
- Starting a REVEN server in the Analyze page of a scenario now generates a Python snippet that can be copied/pasted to scripts and notebooks to connect to the server.
- Added an option to the VM pages to enable UEFI for QEMU VMs.
- Supported QEMU VM format are now detected using QEMU. As a result of this change, the setting variable
QUASAR_QEMU_SCAN_EXTENSIONShas been replaced byQUASAR_QEMU_SCAN_FORMATS.
Axion
- The search combobox now selects the item closest to the currently selected transition when browsing with F4/Shift-F4
- You can now copy the value of a register with a right-click in the CPU widget.
- You can now change the selected instruction by pressing Enter while scrolling a list of memory accesses.
- Double-clicking on a register in the CPU widget will now move the hexdump widget to the value contained in the register.
Fixed issues
Project Manager
- Improved logging when starting up fails due to some external processes.
Axion
- The display of a new widget could sometimes cause the main window to overflow the bottom of the screen. Consequently, the "Maximum docks" option has been removed.
- The trace view now gets the focus upon connecting to a project.
- It was possible to entirely collapse the Hexdump widget and the Strings widget.
- The Trace view would sometimes not follow the cursor when using the percent plugin.
- Clicking on a backtrace item could result in wrong transition numbers being displayed in the CPU widget.
Other changes
- REVEN Enterprise edition now requires a license key to use the software and download software updates. See also upgrading page.
- REVEN is now available as a docker image, allowing to install it on any amd64 Linux.
2.4.0
Highlights
REVEN 2.4 sees the launch of the Professional Edition!
REVEN has been adapted to support Professional licenses accordingly.
Fixed issues
Workflow Python API (preview)
- The Workflow API would sometimes fail a request when a browser was opened on the Project Manager.
Project Manager
- Clearer log messages when starting REVEN fails due to subprocess failures.
Other changes
Automatic scenario recording
- The setting variable
QUASAR_GDB_SERVER_PORT_RANGEis no longer required for the autorecord, so it has been removed.
Axion
- The IDA plugin was renamed to ret-sync plugin because it can be used with both IDA and Ghidra.
2.3.0
Highlights
Ever been frustrated by those missing 32-bit symbols in a REVEN 2.2 trace? Here it is: REVEN 2.3 offers new support for Windows 32-bit OS-Specific Information (OSSI) whether in a 64-bit or a 32-bit scenario.
Ever wanted to easily get the OS process an instruction belongs to? REVEN 2.3 also refines the new APIs brought by REVEN 2.2, adding current process information to the OSSI. Besides, a new status bar in the Trace widget offers detailed contextual OSSI information about the active transition.
OSSI for 32-bit Windows systems
It is now possible to obtain 32-bit symbol information for Windows traces:
- OSSI support for 32-bit DLL in Windows 10 (x64) and Windows 7 (x64) has been added.
- OSSI support for Windows 10 (x86) and Windows 7 (x86) has been added.
Current process information
REVEN 2.3 offers an easy access to the process information associated to a transition in the trace:
- In Axion, in the Trace widget, a new status bar provides detailed OSSI information (process, ring, symbol and binary information) about the active transition. A tooltip with detailed information is provided for each item.
- Process related information is now available through the Analysis API with
Context.ossi.process().
New Guided Tour tutorial of the Axion GUI
REVEN 2.3 comes with a new Guided Tour tutorial of the Axion GUI. Connect to a REVEN scenario with Axion and take the tour!
Axion Menu Overhaul
REVEN 2.3 introduces a brand new menu bar in Axion to make the widgets more readily accessible.
Improvements
Analysis Python API
- Taint API preview: for better compatibility with Axion, marker names created
by
preview.taint.simple_taintare changed from e.g.tag0toTag0.
Workflow Python API (preview)
- Added
ProjectManager.connectto connect to a REVEN project from its name. - Added
ProjectManager.hostnameandProjectManager.portproperties.
Automatic scenario recording
- The autorecord of binary now checks that the required PDBs exist or can be downloaded before launching the recording.
- The recorder logs are now available in the autorecord detail task view,
in the Project Manager
Tasks and Sessionstab. - The autorecord of x86 binaries on x64 Windows now generally results in trace starting at the first instruction of the
binary (on the entry point) rather than the
CreateProcessInternalWfunction. - The overall reliability has been improved.
Project Manager
- Colored dots are now displayed next to the scenario status in the
Scenario Managertab.- Red dots indicate resources that are out-of-date and must be replayed again so that their dependent features work with the current version.
- Orange dots indicate resources that are out-of-date, but compatible with the current version.
- The
kernel_descriptionis now replayed during the 'Replay' step when theOSSIfeature is selected, rather than generated in the 'Prepare' step of the snapshot. This allows to see the current version of thekernel_descriptionresource. - Projects now start faster.
Axion
- When the Symbol Call Search (which is fast) is available, the Symbol Search
(which is slow) is now disabled. In other words, the slower Symbol Search is
only enabled when the
binary_rangesandpc_rangesresources are not available. - The backtrace widget is now faster when the
binary_rangesresource is available.
Fixed issues
Project Manager
- Fixed an issue that prevented having more than one started Axion session in the browser.
Axion
- Search widget: Fixed an issue where selecting an item in the completion list would sometimes result in a different item appearing in the search symbol field.
2.2.1
Highlights
-
T3377 - Fixed a disassembler issue:
- In Axion trace view,
jmpandcallinstructions would sometimes display the wrong target address. - In the Analysis Python API, the
Instructionobject would sometimes contain wrong operands for relativejmpandcallinstructions. Due to this fix, you may observe longer replay duration for the PC range and stack events resources.
- In Axion trace view,
-
Made it impossible to start non-leaf QEMU snapshots. This fixes an issue where starting such snapshots would corrupt their child snapshots.
Improvements
Analysis Python API
- Improved the performance of the
Context.readmethod up to x3 in typical workloads. - Added a
timeoutargument to theString.memory_accessesmethod, allowing to specify how long this function should attempt to recover all accesses before raising an exception.
Project Manager
-
It is now possible to rename scenarios from the Project Manager web interface. As a result of this change, the name of scenarios must now be unique.
Important: If you already have scenarios that share the same name, they will be renamed upon installation by adding a suffix containing a number to all scenarios sharing the same name. The suffix is
2.2.1-renamed-number. -
The
snapshots > readendpoint of the REST API now adds a list of the live QEMU snapshots in the details of the snapshot. This is useful when doing automatic recording. -
Starting a QEMU snapshot session with more than 2048MB of RAM is now allowed. RAM must not exceed 3072MB on a QEMU snapshot session to record scenarios.
Fixed issues
Analysis Python API
- T3378 - Modified
Stack.backtraceproperty so that it returns a string instead of printing it. - T3388 - Made the
ifregister accessible from the Analysis Python API. Previously, attempting to accessreven2.arch.x64.ifwould raise aSyntaxError, becauseifis a Python keyword. The register is accessible throughreven2.arch.x64.if_.
Project Manager
- Fixed starting Axion and the VM in the browser when a SSH X forwarding connection is open.
Limitations and known issues
Unchanged since 2.2.0.
2.2.0
Highlights
For REVEN 2.2.0, the keyword is Automation, that is, ways to work with REVEN more productively and more in-depth by automating various tasks.
In details, this release is the first version to contain the high-level Analysis Python API, the low-level Workflow Python API, and various facilities for Automatic scenario recording.
Note that this release contains features marked as preview, whose APIs are included for early use. Tetrane is looking forward to your feedback on these new advanced features and accordingly reserves the right to introduce breaking changes to these APIs.
Analysis Python API
It is now possible to use Python to query data from a REVEN server running on a scenario. For this release, supported features include: reading from a Context or a Transition, OSSI, memory history, search, backtrace and strings. The taint feature is also available as a preview package.
Note that the REVEN v2 Python API can be imported from IDA, allowing to combine information from the IDA Python API and the REVEN v2 Python API.
More information on the Python API is available in the quick start guide, that you can find inside the documentation served by the Project Manager.
Workflow Python API (preview)
It is now possible to use Python to automate the workflow of the Project Manager. The API offers methods that allow to perform some of the actions available from the Project Manager web interface.
For more information, please refer to the Project Manager API examples on the Downloads page newly added to the
Project Manager.
Automatic scenario recording (preview)
It is now possible to record QEMU scenarios automatically using the Workflow Python API. Two main workflows are supported today:
- Start recording immediately after starting a binary, and stop recording automatically when the binary exits or crashes. REVEN can also stop the record upon a BSoD.
- Use "magic" ASM instruction sequences to start and stop the record at any time from within the guest VM!
For more information, please refer to the automatic recording cookbook in the documentation served by the Project
Manager and to the various automatic recording examples on the Downloads page of the Project Manager.
Improvements
Project manager
- Added a new
Downloadspage, accessible from the footer, that allows to download various REVEN tools and examples directly from the Project Manager. For instance, the REVEN Python API can be downloaded from this page. - Added a new
API REFERENCElink to the footer that redirects to the Python API reference documentation. - The replay generation time has been improved by about 30% for the PC range, stack events and memory history resources.
- Streamlined port handling in the Project Manager: When the
QUASAR_{PQSL,REDIS,WEBSOCKIFY}_PORTvariables are set to a value, those fixed values are used as port numbers, which makes it easier to put the Project Manager behind a reverse proxy. If set to None or to 0, the corresponding ports are picked randomly among available ports at startup, making it easier to have several Project Manager instances running on the same machine without port conflicts. - Advanced users can now select the number of tasks allowed to run in parallel with the
QUASAR_CELERY_CONCURRENCYvariable. This allows users to fine-tune the behavior of the replay according to the configuration of their machine.
Axion
- Taint widget: the taint is now usable from a remote Axion client! Previously, the taint was only usable if the Axion client was on the same machine as the corresponding REVEN Server. This limitation has now been lifted.
- Taint widget: the widget now displays warnings that occurred during the taint. Warnings tell the users about events that may impact the correctness of the taint. Warnings are displayed in a dedicated "Warnings" tab, and also as a Warning icon next to the affected change in the change view.
- Axion now exposes
reven2rather thanrevenin thePythonQtconsole.
Fixed issues
Project manager
- TIS-34, GS-11, EP-2 - Fixed download PDBs
FileNotFoundErrorthat would stop the task and mark it as failed. - GS-10 - Fixed XSS vulnerability in the Scenario Description field.
- Fixed an issue for scenarios recorded using QEMU, where the last context would sometimes contain incorrect values after replay. Replay your scenario trace and memory history if you need to fix them.
- Fixed an issue where memory usage would increase a lot after running the Project Manager for a long time
- Removed the
Terminallink that was opening a new terminal on the server, but was unreliable.
Axion
- T3103 - Bookmark widget: The "filter" field now filters on all columns of the bookmark rather than just on the transition number
- T3259 - Search widget: Returning many results from a search would result in a freeze of the combo box used to select results upon being clicked. The combo box is now disabled when too many results are returned by a search, and prev/next buttons have been added to iterate the results.
- T3287 - Taint widget: the default shortcut has been changed from Ctrl-T to Alt-T to better accomodate Axion when launched in the browser
- EP-4 - Added a
closebutton to the operand tracer widget that hides the widget
Limitations and known issues
- Only a single taint can run concurrently per REVEN server: currently, starting a second taint, even from a different Axion, will cancel the first running taint. Besides, if two Axion sessions are involved, the first Axion session may display mixed taint results.
- If a taint generates many changes, the taint widget may slow down Axion. Cancelling the current taint operation will revert Axion's slowdown.
- When using the auto-record functionality, the replay operation may fail at the start of the trace with the
following error:
detect_infinite_loops: Assertion 'false' failed. Performing a new scenario recording usually fixes the issue.
2.1.0-beta
Highlights
- Scenario Import/Export: Scenarios can now be exported to share and/or archive them. Refer to the Project Manager documentation for more details.
- Full-web client interface: VMs and Axion can now be used directly in the web browser,
meaning Reverse Engineers can use REVEN from any Linux, Windows or MacOS client and without any client installation.
This feature is currently disabled by default and can be enabled in
settings.py. Please refer to the installation documentation for more details.
Improvements
Project manager (Quasar 2.1.0-beta)
- Light OSSI resource: in order to analyze a scenario with OSSI information, one needs
to prepare the snapshot of the scenario and extract the full filesystem (FS) of the VM. While this operation is still
required, it is now possible to generate a
light FSscenario resource that only contains the files involved in the scenario. This new resource allows to:- Unprepare a snapshot, which will delete the full FS and preserve only the light FS, saving disk space.
- Download PDBs only for the binaries present in the light FS, thus saving bandwidth, time and disk space.
- QEMU snapshot management has been improved:
- Disk and live snaphots can now be deleted from the UI.
- The RAM size is now displayed in MB rather than GB for greater flexibility.
- A new
custom_optionsfield allows user-defined QEMU options to be passed when preparing a VM or recording a scenario. - The RAM size, network options and custom options can be overriden in a snapshot inheriting from a parent snapshot, or before recording a scenario.
- Parameters for the Strings replayer can now be configured in the Project Manager settings.
Axion
- Adding a bookmark now systematically sets the bookmark on the currently selected transition in the Trace view. Previous behavior was widget dependent and possibly confusing.
- A new
--maximizeoption allows to start Axion as a maximized window.
REVEN server
- Taint: Direct Memory Write Accesses (DMA) now correctly untaint memory.
- Taint: the user is warned when the taint encounters FPU instructions, that are not currently supported.
Fixed issues
Project manager (Quasar 2.1.0-beta)
- Tasks: improvements in error handling.
- Fixed some performance issues in page generation.
- PDB downloading: fixed bug where download would fail for file paths containing spaces.
- Various fixes and UI improvements in the VMs, scenario and task/sessions pages.
Axion
- Strings widget: improved stability.
- T2723 - Fixed bookmarking bug where bookmarking a sequence was sometimes impossible.
- T2781 - Trace view: fixed bug where the trace view could be empty.
- T2995 - Fixed percent plugin not working anymore after update.
- T2767 - Fixed Hexdump scroll up "warping" to an unspecified location.
REVEN server
- Taint: fixed some correctness issues.
- Windows OSSI: fixed possible infinite loop while getting the modules of a process.
- T2989, T2406 - Fixed possible REVEN server crash on startup.
2.0.2
Improvements
Axion
- Added load plugin and exec script with file dialog in Axion Python console.
- Use
axion.iexec_script()to execute a script. - Use
axion.iload_plugin()to load a plugin.
- Use
Fixed issues
Axion
- Fixed IDA-sync plugin.
2.0.1
Improvements
Project manager (Quasar 1.0.3)
QUASAR_LIVE_PDB_DOWNLOADis now set toFalseby default.- Improved UI by adding indentation on many pages.
Axion
- T2924 - In widgets displaying tables, the horizontal scrollbar now moves pixel by pixel rather than column by column.
- T2946 - Taint widget: warning emitted by backward taint can now be closed.
- T2904 - Align transition number on the right in the following widgets: memory history, backtrace, bookmark, string access, taint.
- T2917 - Bookmark widget: correctly display binary name when symbol name is unknown.
- T2944 - Demangling: added support of CXX mangle format for Windows64 OS.
- Allowed to use
axion.ext()to exit Axion from plugins.
Low-level bindings
- Bind
get_current_processnetwork service in the low-level bindings.
Fixed issues
Project manager (Quasar 1.0.3)
- Improved UX when errors occur during the start/stop process of the Project Manager.
- Improved error handling when the Project Managers calls external programs that may fail.
- Various fixes and small UI improvements in the scenario and VM management workflow.
Axion
- Backtrace widget: improved performance.
- T2954 - Framebuffer widget: fixed framebuffer not displayed on first transition.
- T2901 - Framebuffer widget: zoomed position in the framebuffer widget is not reset anymore when time-traveling.
- T2898 - Trace view: fixed display of sequences in trace view in some cases.
- Trace view: fixed display of long UTF16 strings.
REVEN server
- T2922 - Taint: Support
iretqandxaddinstructions in the taint. - T2940 - Taint: Improved performance of the backward taint in some use cases.
2.0.0
- Added 64-bit support to REVEN server and Axion to analyze 64-bits Intel systems.
- Released Project Manager (Quasar 1.0.2) to manage all resources needed with REVEN (VMs, snapshots, scenarios, etc.).
Creating and configuring Virtual Machines for your project
With REVEN, you can build RE projects where scenarios to analyze are recorded from Virtual Machines (VMs) running in QEMU.
This section will describe how to add, configure and manage these Virtual Machines:
- First, the What you need to know section will explain necessary concepts and terminology.
- Second, you will want to head over to Adding new VMs.
At this point, you will have at least one VM installed. You can head over to the Scenario section to record scenarios and more.
This section also contains more advanced topics:
- Advanced VM operations that will become useful as you use your VMs more and change their configuration.
- How to manage PDBs on air-gapped networks, if such is your use-case.
- Troubleshooting if you have errors when using VMs.
What you must know
This section contains basic information about concepts and objects used when managing Virtual Machines.
QEMU modes: KVM vs emulation
When using REVEN with QEMU VMs, you will have to switch between two virtual machine mode, because recording is restricted to full emulation mode:
| Mode | Technology | Speed | What we use it for |
|---|---|---|---|
| KVM | Virtualization with hardware support | Fast | Installation, heavy configuration |
| Emulation (TCG) | Full software: code for each instruction | Slower | Recording, simple configuration |
From the point of view of the guest OS running, these two modes are completely different hardware. Going from one to the other is akin to moving a physical hard disk between two machines, and as a consequence requires properly shutting down the VM before making the switch.
Note: the same is true when changing most other hardware options, you must do it while the VM is shut down.
Snapshots
REVEN uses the native disk / live snapshot mechanism from QEMU which might differ from what users expect. Two different objects are called "snapshots", so to avoid any confusion we need to differentiate:
| Name | What it is | Support switching VM modes |
|---|---|---|
| Disk snapshot | The living VM's hard disk | Yes, by shutting the VM down |
| Live snapshot | A frozen state of a running VM, to be restored anytime | No: must be restored using the same mode it has been created with |
Live snapshots are very handy, because they provide a very quick way to restore a VM from a known good VM state, instead of having to wait for the VM to boot up. This is even more true in Emulation mode, where booting a VM takes a few minutes.
Finally, note that the above table is a simplification. Notably, live snapshots are stored within the qcow disk snapshot file itself, and this is reflected in the Project Manager's organisation.
You can now head over to the Adding VMs section.
Adding new Virtual Machines
This section will describe various means of adding new Virtual Machines for use when recording scenarios.
- Importing an existing VM will guide you through importing an existing disk into REVEN.
- Guest configuration is a crucial set of instructions on how to configure new VMs.
- Create a VM from an ISO if you want to install a fresh VM.
- The Misc. section contains various pieces of information regarding VMs in REVEN: where they are stored, supported formats, etc.
Importing an existing VM
The Project Manager offers a VM import Wizard that will guide you through the process of importing a VM disk by provisioning, registering and preparing a QEMU VM in REVEN.
Typical import
In a typical import case, you will use the VM import Wizard to:
- First, provision your VM, that is, make the disk image available to REVEN.
- Then, registrer it so that REVEN can use it. This step also gives you the opportunity to perform some necessary configuration.
The Wizard guides you through each step, so you don't need to remember them all. However, understanding the process will help you:
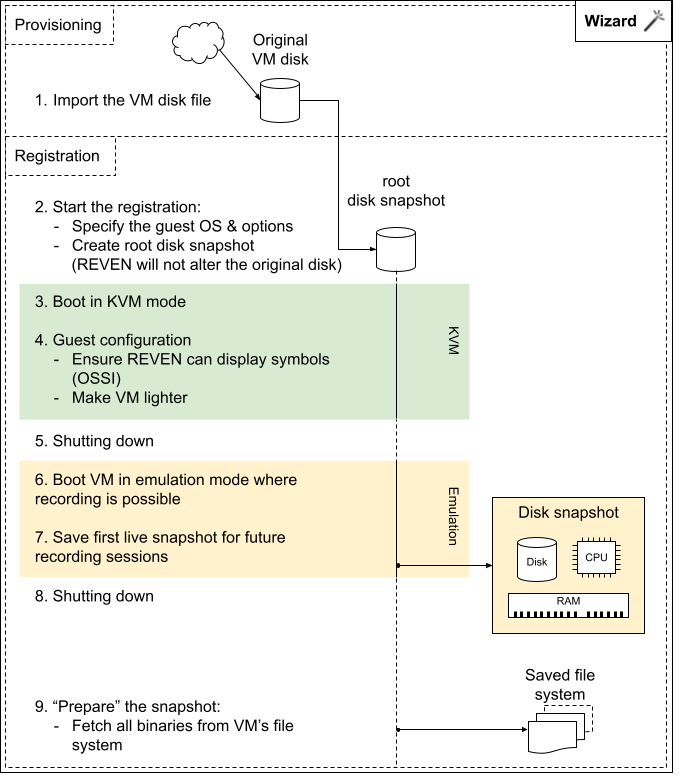
The reason we create a live snapshot of the booted VM is because it is much more convenient to restore one when getting ready to record a scenario, rather than boot the VM from the start.
If you wonder why we need to mix KVM and Emulation mode, please read the Need to Know page.
Provisioning an existing VM
Provisioning a VM means somehow putting a VM disk to the proper location on the server so that REVEN can have access to it. There are multiple possibilities of doing so.
- Using the Project Manager:
- Open the
VM Managerpage. - Click on
Register QEMU VMto start the VM import Wizard - Select one of the two
Provisionoption by click on either button - Follow the wizard to upload a disk image (see supported formats)
- Open the
- Alternatively, you can manually copy a
qcow2disk image to the VM storage location.
You should now see the VM disk image appear in the Register new VM section of the Wizard's VM Setup page.
Registering a provisioned VM
Registering a VM will allow REVEN to use it to record scenarios. The Wizard will guide you through a collection of steps that include settings REVEN options, possibly configuring the guest OS, and ultimately creating a live snapshot. See typical import above.
You must use the Project Manager's Wizard to register a VM:
- In the Register new VM's combo box, select the VM disk to use
- Click on Register VM
- Follow the Wizard. Below are details about some of the steps it takes:
- In the Specify guest page:
- Specify the target OS & architecture, and RAM size.
- Check "Use UEFI" if the OS has been installed with UEFI support only. Otherwise, legacy BIOS will be used.
- You can leave Custom options empty.
- The Configuration of the windows guest is a very important step, please read Guest configuration.
- In the Create live snapshot you will boot your VM in emulation mode.
- Wait a bit after boot to ensure the CPU activity is low enough (idling at 10% is good) before taking the snapshot: it is common for OSes to display some background activity right after booting up.
- Finally, when asked to "Prepare" the snapshot, please click on the Prepare button. If you skipped this operation, you can still prepare it later while on the snapshot's details page.
- In the Specify guest page:
You now have a ready-to-use VM! You can head over to the Scenario section to record scenarios and more.
Guest configuration
This section describes how to configure the guest environment that will be used for recording. Notably, this includes:
- Reducing the background OS activity to what is strictly necessary, to avoid recording irrelevant processes. For example:
- Disabling background services,
- Deactivating anti-viruses,
- etc.
- Ensuring REVEN can reconstruct OS-Specific Information (OSSI) from the scenario once recorded, for instance:
- Disabling certain security features which hinder kernel memory querying.
- On Linux, populating the VM with debug binaries for symbol retrieval.
As the processes are very different from one OS to another, they are separated:
Guest Configuration for Windows
This page will detail how to properly configure a Windows guest for recording with REVEN.
- Guest system requirements
- Enabling the OSSI feature
- Optimizing the guest for analysis
- Maximizing the symbol coverage
- Final touches
- More details about version support
Guest system requirements
REVEN supports guests running Windows from version 7 to 10, both 32-bit and 64-bit editions, up to the latest releases.
For more details, see the section below
Enabling the OSSI feature
In order to ensure the OS-Specific Information (OSSI) work on recorded scenario, you must disable certain OS features manually. Below are instructions on how to do so.
Disabling the KPTI protections
KPTI (Kernel Page-Table Isolation) protections were introduced with the meltdown patches. If they are enabled, OSSI will be available only on ring 0 or admin processes, so you must disable them.
Therefore, you must disable KPTI protections. You can either:
- During the
Configure the gueststep of the VM Import Wizard:- In the Project Manager, click on
Insert Windows 10 lightener CDROM. - In the VM, open a file explorer to the CD-ROM drive.
- Right-click on the file
disable-kpti.batand selectRun as administrator. - Wait for the VM to reboot.
- In the Project Manager, click on
- Outside the VM Import Wizard, you can run this manually. Microsoft's support provides the following steps to do so, to run in an Administrator shell:
reg add "HKEY_LOCAL_MACHINE\SYSTEM\CurrentControlSet\Control\Session Manager\Memory Management" /v FeatureSettingsOverride /t REG_DWORD /d 3 /f
reg add "HKEY_LOCAL_MACHINE\SYSTEM\CurrentControlSet\Control\Session Manager\Memory Management" /v FeatureSettingsOverrideMask /t REG_DWORD /d 3 /f
shutdown -r
Disabling the CompactOS Windows 10 option
On Windows 10, the CompactOS feature lets you run the operating system
from compressed files to maintain a small footprint. However, this feature
is not compatible with the Prepare stage of the REVEN workflow, which is
required by the OSSI features.
Therefore, you must disable CompactOS. To do so, issue the following command as the Administrator user:
> Compact.exe /CompactOS:never
Uncompressing OS binaries /
Completed uncompressing OS binaries.

15483 files within 11064 directories were uncompressed.
Note you can check the status of that feature with Compact.exe /CompactOS:query, and if necessary for your particular use-case and if you know what you are doing, reactivate it with Compact.exe /CompactOS:always.
Optimizing the guest for analysis
In order to optimize scenario recording and replay performance, it is strongly recommended to remove system features that are not useful to your scenarios. We call this operation ligthening the snapshot.
Indeed, a default installation of Windows 10 is quite busy by default, and makes the experience poorer than it needs to be: any background or superfluous task or program that runs on the VM while recording a scenario will negatively impact both the recording experience (the VM runs slower than it needs to) and scenario size and replay time (REVEN will analyze unnecessary code execution).
The following two sub-sections will detail two different approaches you can take:
- Either use the provided powershell script - this option is recommended by default,
- Or use the NTLite template - this option can be even more effective, and is recommended if you have an NTLite license.
Note that you can also simply deactivate things manually yourself - look at what the script does for inspiration.
Using the provided Powershell script
This script is available from the Downloads page of the Project Manager.
IMPORTANT: This script is provided to REVEN's users as-is,
without any guarantee, as a convenient tool. Therefore, it must be
considered for what it is - an example. It is strongly recommended to backup
any VM before running the script on it. Besides, the script may require
modifications to fit your specific configurations. For example, non-English VMs
may require some translation in the script, such as administrator to
administrateur in a French VM.
IMPORTANT: By default, running this script will disable the network. See below for how to reactivate it.
Before using the script, apply the following configuration:
- Disable Windows Defender and optionally the firewall:
- As an Administrator, launch
gpedit.msc. - Navigate to "Local Computer Policy\Computer Configuration\Administrative
Templates\Windows Components\Windows Defender\Turn off Windows Defender" and
set the
Enabledradio button. - Navigate to "Local Computer Policy\Computer Configuration\Windows
Settings\Security Settings\Windows Firewall with Advanced Security" and
set it to
Off.
- As an Administrator, launch
On Windows 10, in an administrator Powershell console, you can:
-
Get help about the script's capabilities and usage:
> Get-Help windows10_lightener.ps1 -
Run the script to disable a maximum of services:
> Set-ExecutionPolicy Unrestricted
(confirm)
> windows10_lightener.ps1 -All
Manually disable the following services:
-
Print spooler
-
DPS
-
Themes
-
Workstation (SMB protocol) IMPORTANT: In order to enable networking, reactivate the following services:
-
Windows Event Log
-
Network Connections
-
Network List Service IMPORTANT: Anti-virus disabling as done by this script is not persistent after a VM reboot, which is is why we recommended disabling it via groups policies above. Alternatively, the script may be executed after each reboot to disable the AV services again:
> Set-ExecutionPolicy Unrestricted (confirm) > windows10_lightener.ps1 -DisableAV -
-
Run the script to disable basic services only:
> Set-ExecutionPolicy Unrestricted
(confirm)
> windows10_lightener.ps1 -Basic
Using the provided NTLite template
NTLite is a tool easing the process of customizing
Windows. It can be used on either a running system, such as a VM, or on an
installation ISO. The way the provided template is supposed to be used is on a
live, running system.
You will need at least a NtLite Home license to modify your VM.
Please follow the instructions below during the "Configuration of the windows guest" step of the "VM setup" wizard:
- Install NTLite on the VM. You can transfer the NTLite setup file through the "file CDROM" feature.
- Activate your NTLite license on this VM.
- Load the current Windows installation into NTLite.
- Load the provided template by inserting the "Windows 10 lightener CDROM".
- Apply the changes required by the template. A few reboots may be required to fully apply all the modifications.
- You will be done when all the changes will have a green bullet in the "Apply" section of NTLite.
NOTE: Installing NTLite on the VM may require an active internet connection. Please refer to NTLite's documentation for more information about how to install NTLite.
Maximizing the symbol coverage
For Microsoft Windows systems, OSSI can be derived from binaries and Program Data Base files, also known as PDBs.
REVEN will automatically download PDBs, provided:
- the binaries executed in your scenarios are in the prepared file system (see What preparing a snapshot is)
- It has access to a PDB source (by default REVEN knows about microsoft's PDB servers and a few others)
This automatic download will either occur during Replay or if Enable live PDB download in the scenario's analysis page is checked (although the latter option is not recommended as it will freeze the GUI during each new PDB download)
Final touches
Finally, here are a few recommendations to make the overall experience smoother:
- Install all .NET & MSVC runtimes: you will need them.
- Force .NET precompilation with commands such as
%windir%\microsoft.net\framework64\v4.0.30319\ngen.exe update /force- otherwise it may consume CPU time when you least want it to (see Microsft's support about that issue) - Setup autologon (use Autologon) - this makes creating live snapshots smoother, as you don't have to login everytime.
- Install all the software you may want:
- Process explorer / hacker
- Your favorite web browser
- Etc.
More details about version support
We support and test REVEN against new Windows 10 major updates when they get released, however if you have problems against a specific version, please contact the support.
We occasionally test against Insider Preview builds in a best-effort fashion.
Please note that we consider Windows 10 64-bit a priority, and as a result there are features that do not support older Windows versions or 32-bit editions. Here is a summary of those features:
| Feature | Perimeter |
|---|---|
| Automatic binary recording (excl. ASM-stub recording) | Windows 10 64-bit |
| Snapshot lightening | Windows 10 64-bit & 32-bit (Not mandatory on Windows 7) |
| PCAP network activity reconstruction | Windows 10 64-bit |
Guest Configuration for Linux
This page will detail how to properly configure a Linux guest for recording with REVEN.
IMPORTANT: We strongly recommend you start with one of the VMs available on tetrane's website. These are already properly configured and tested.
- Guest system requirements
- Enabling the OSSI feature
- Maximizing the symbol coverage
- Optimizing the guest for analysis
- Final touches
Guest system requirements
REVEN requires Linux guests to be running a compatible kernel: Linux 64-bit, versions 4.1 to 4.18.0 included.
- Tested distributions:
- Fedora 27 (kernel version 4.13)
- OpenSUSE 15.1 (kernel version 4.12.14)
- Debian 9 (kernel version 4.9)
- Ubuntu 16.04 (kernel version 4.13)
- CentOS 8 (kernel version 4.18.0)
- Other untested distributions in the compatibility range:
- OpenSUSE 15.0 (kernel version 4.12)
- Ubuntu 17.10 (kernel version 4.13)
- NixOS up to 18.09 (kernel version 4.14)
- ...
NOTE: each distribution and version can have its own peculiarity, and require further configuration not descibed in this guide. Moreover, there could be specific set of patches that hinders the OSSI retrieval. Again, we recommend starting with a VM available on tetrane's website. Finally, you can contact the support if you cannot get OSSI when using a distribution from the list above.
Enabling the OSSI feature
In order to ensure the OS-Specific Information (OSSI) work on recorded scenario, you must:
- Disable KASLR and PTI protections,
- Install the kernel headers in the guest.
Disabling KASLR and PTI
You need to add the nopti and nokaslr options to your kernel command line. On most systems, the following procedure should work almost as-is:
- Edit the file
/etc/default/grub. - Find the variable
GRUB_CMDLINE_LINUX_DEFAULT. - Add the
noptiandnokaslroptions, making the line look like this:GRUB_CMDLINE_LINUX_DEFAULT="[...] nopti nokaslr" - Regenerate your grub configuration:
update-grubfor Debiangrub2-mkconfig -o /etc/grub2.cfgfor CentOS- Other distributions should work in a similar way.
- Reboot.
- Verify that you have the options present in
/proc/cmdline.
Installing the kernel headers
For Debian-like distributions, this should be done with a command similar to this one: sudo apt install linux-headers-$(uname -r)
For RedHat-based distributions, the command is more like the following: sudo dnf install kernel-devel kernel-headers
Maximizing the symbol coverage
NOTE: 32-bit binaries are currently not supported by the OSSI feature for Linux.
You should install as many debug symbols on the guest as possible.
By default, symbols are searched within the binaries executed in a scenario. These production binaries usually contain very few symbols.
Most distributions provide a mechanism to download debug symbol packages, which the debuggers can then use to display more context to the user. REVEN can leverage those as well completely transparently, as long as you "prepare" the snapshot after installing them (see What preparing a snapshot is).
The process of recovering debug symbol packages will vary for each distribution, but here are a few pointers to get you started:
Debian-like distributions
You can follow the steps below:
- Install
apt-fileandgrep-aptavail.apt install apt-file dctrl-tools - Add the debug package sources to your
/etc/apt/sources.list. For debian:
wheredeb http://deb.debian.org/debian-debug/ <your_release>-debug main<your_release>is the codename of the target release of Debian (e.g.stretch,buster,bullseye) - Update your apt and apt-file:
apt update apt-file update - Look for all the binaries on your system:
# https://unix.stackexchange.com/questions/40063/how-to-find-executable-filetypes/448075#448075 find /path -type f -exec sh -c "file {} | grep -Pi ': elf (32|64)-bit' > /dev/null" \; -print - For Debian Buster and newer, you can use
find-dbgsym-packagesfrom thedebian-goodiespackage on your binary:
And you're done!find-dbgsym-packages <binary> - For other distributions, for each binary, look for its build id and debug link:
readelf -n <binary> | grep "Build ID" readelf -p.gnu_debuglink - If you have a build ID, you can use it with
grep-aptavailto recover the debug package:
And you're done!grep-aptavail --no-field-names --show-field Package --field Build-IDs <build_id> - Without a build ID, you can build debug paths for your binary from the debug link, and pass it to
apt-file:
And you're done!apt-file search "/usr/lib/debug/<binary_parent_dir>/<debug_link>" apt-file search "<binary_parent_dir>/<debug_link>" apt-file search "<binary_parent_dir>/.debug/<debug_link>"
Once you recovered the debug package names, you can then install them using apt install.
More resources:
Fedora
You can use sudo dnf debuginfo-install <packagename> for all installed packages to get their debug counterparts.
More information:
Optimizing the guest for analysis
Linux system usually display far less background activity than a default Windows 10 installation, so there is no mandatory step in that regard.
Nevertheless, there are steps you can take to make the VM lighter still:
- If you don't need a GUI:
- Disable Xorg server when not needed,
- Disable the console framebuffer if not needed. For example, on Debian systems, in file
/etc/default/grub, add the line:GRUB_TERMINAL=console
- Install a light Desktop Manager, such as Xfce,
- Disable any unwanted background service.
Final touches
Finally, here are more general recommendations to make the experience better.
- Since REVEN supports a narrow set of kernel versions, you should inhibit kernel updates:
- On Fedora: add
exclude=kernel*to/etc/dnf/dnf.conf - On Ubuntu: run something akin to
echo linux-image-xxx hold | dpkg --set-selections
- On Fedora: add
- Don't forget to install your favorite tools:
gcc,htop, etc.
Creating a new VM from an ISO
You can create a QEMU .qcow2 VM by installing an operating system from an ISO.
The Project Manager does not guide you through all steps required for this operation. As a consequence, in conjunction with using the VM import Wizard, you will also need to run commands via a terminal on the machine REVEN is runnning on. Below are two recommended methods to approach this.
IMPORTANT: This page will assume you are familiar with how to import a VM.
For both methods, you need to know where the Project Manager stores the virtual machine's disks (see VM storage location) - in the steps below, we will call this path /path/to/VMs/.
You must also copy your installation ISO file on the server by your own means (sFTP, scp, or other). In the next steps, we will call the path to the ISO file /path/to/ISO.
Without direct or SSH access
- In the Project Manager, open the NOTEBOOKS link in the page's footer to open Jupyter.
- Once in Jupyter, open a new terminal session as follow:
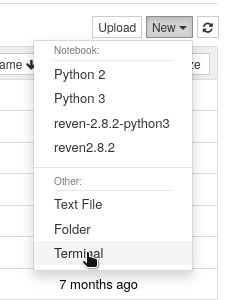
- From the terminal, run
qemu-img create -f qcow2 /path/to/VMs/myimage.qcow2 80G, where/path/to/VMs/is the VM directory found above. Note you should adapt the name and size of the disk to your requirements. - Once this disk is created, you can start importing it using the Project Manager VM import Wizard as described in previous sections.
- When asked to create a child snapshot, do so (even if this disk is still empty). Write the name down, we will refer to it as
root. - The first time the Wizard requests you start the VM:
- Check "Override custom options",
- Enter the custom option
-cdrom "/path/to/ISO", - Click on "Start" to start the VM with your ISO file.
- If the VM does not show up, use the link "Show in browser". Your ISO file will take precedence in the boot as expected, allowing you to install the VM.
- Once your VM is installed, shut it down properly.
- Leave the Wizard open at this step and go back to the Jupyter terminal.
- At this point, your base disk is empty, and your OS has been installed to the first disk snapshot. Instead we want the base disk to contain this vanilla installation, and later use the first snapshot to lighten the VM further. Hence, "commit" all changes to the base image using the command
qemu-img commit /path/to/VMs/myimage.qcow2.snapshots/root.qcow2. - You can now close the Jupyter terminal. Head back to the Wizard. You might get a warning on this page, in which case simply click on the "Refresh" button.
- Uncheck "Override custom options" then click on "Save Setings".
- You are now back into the normal workflow: you can stay at this step to perform the necessary operations to make your VM lighter on
rootby disabling unnecessary services (see Guest Configuration), then continue on to create the first live snapshot and finish the Wizard.
With direct or SSH access
If you have direct access to the server and can log into it, or if you can connect to it via SSH, you can run steps similar as above but using your access instead of the Jupyter terminal:
- Get a shell on the server using your SSH or direct access. Make sure you are connected as the user that is running REVEN.
- Continue on with the procedure above, using this shell instead of Jupyter's.
Moreover, if you can run a GUI application on the server (X-forwarding or direct graphical access), you can chose to pre-install the OS to the new disk image prior to importing it in REVEN. Below is a general list of steps you can take in this situation:
- Start your terminal session allowing for GUI application: either by logging into the server's desktop, or by starting an SSH session with X-forwarding (
-Xor-Y). - Execute the command
source /path/to/REVEN/install/sourcemeto make sure you have access to the necessary binaries. - Create your VM disk with
qemu-img create - Manually start the VM, with the iso inserted by running
panda-system-x86_64 -m "2048M" -hda "/path/to/VMs/myimage.qcow2" -usbdevice tablet -enable-kvm -cdrom "/path/to/ISO". Again, adapt parameters as needed. - The VM should show up on your screen and start the installer from the ISO file. Continue on with the installation.
- Shutdown the VM properly.
- You can now run the Project Manager's Wizard to import your newly created VM disk.
You now have a ready-to-use VM! You can head over to Scenario to record scenarios and more.
Misc.
This page contains general information about Virtual Machines in REVEN that can be useful at various stages when using the product.
VM storage location
For certain operations on this page, you need to know where the Project Manager stores the virtual machine's disks.
By default, this path is ~/VMs.
You can find it either:
- By starting the registration of a QEMU VM. In the 2nd step, where the Wizard asks you to select which disk to import, you can find the VM disk path on the label "Select a VM file from the existing files".
- Alternatively, in your settings file as
QUASAR_QEMU_SCAN_PATH.
Supported disk formats
Note that the native disk image format REVEN supports is qcow2.
That being said, the VM provisioning step in the Project Manager can convert the disk image from multiple formats for you. It uses the tool qemu-img to do so, and so supports all formats this tool does. They include:
qcow(version 1)vdivmdkvhdx
These formats are listed by the QUASAR_QEMU_SCAN_FORMATS variable in your settings, see the documentation of this variable in settings.py for more information.
Note: the ova format is not in this list because it is not directly a disk image, see below for how to work with this format.
Adding a VM in OVA format
To use a VM in Open Virtual Appliance (OVA) format with REVEN, please follow the steps below:
- Unzip the OVA archive.
- Use the VM preparation Wizard to upload the
.vmdkor.vdi(depending on the OVA) file contained in the archive from your disk to the server. - Let the VM Wizard guide you through the next steps.
Archiving and importing VMs back
While the Project Manager does not provide an explicit VM export functionality, you can manually archive VM disks & snapshots in the VM storage location.
To export a VM, you can:
- Open a shell to the server and change your current directory to the VM storage location.
- Compress a VM along with all its snapshots with a command such as
tar -czf myVmArchive.tar.gz MyVmDiskName.qcow2*. Note the*at the end of the command to include disk snapshots. - You can now move the archive
myVmArchive.tar.gzto any location you want.
To import a VM archived with the above method, you must now provision the VM manually and register it:
- Open a shell to the server and change your current directory to the VM storage location.
- Extract the VM disk files with a command such as
tar -xf myVmArchive.tar.gz - Now open the Project Manager's VM import Wizard, and select the VM disk
MyVmDiskName.qcow2 - Fill the VM Setup page and click Next
- At this point the Wizard will detect that the VM already comes with a set of disk snapshots. Click on "Importing".
Your VM is ready to use.
NOTE: when importing an archived VM, you should not use the Wizard's provisioning step: the latter would not upload the disk snapshots along the disk image, and you would then have to recreate them from scratch.
Advanced VM operations
This page will guide you through more advanced concepts and operations you can do on VM and snapshots. The need for these will arise when you start working more heavily with your VMs, changing configuration, installing new software, etc.
- Snapshot page in the Project Manager
- More about snapshots in QEMU
- VM Hardware options
- What preparing a snapshot is
- How to prepare a snapshot
- Disk snapshot statuses
Snapshot page in the Project Manager
To find a disk snapshot page:
- Browse to the VM manager tab.
- Find the VM you want in the list.
- To the right is the list of disk snapshots available for this VM.
- Click on the disk snapshot you want to access.
From this page, you can:
- Customize the hardware options
- Boot the VM:
- Access it
- Upload files via the CD-ROM
- Manage live snapshots
- Prepare the snapshot
More about snapshots in QEMU
We already cover basic differences between live and disk snapshots in the page What you must know, but here is the full view.
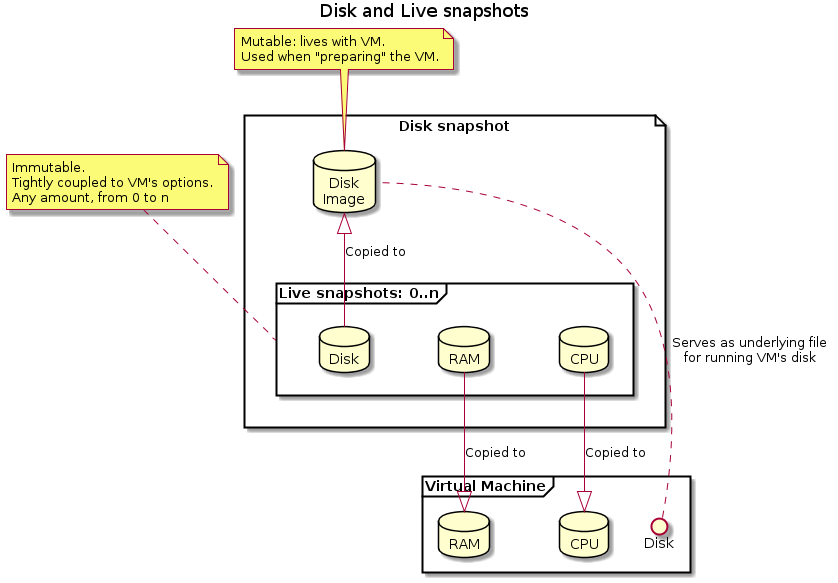
Disk snapshots:
- represent the mutable disk the VM has access to.
- are overwritten when restoring a live snapshot, with the latter's disk state.
- may be organized in a tree structure to save disk space.
Live snapshots:
- represent the full state of a VM, including memory, cpu registers and disk
- are immutable
- are tightly coupled to the options the VM has been started with: selecting the wrong options will prevent snapshots from loading (this includes "kvm", "network", or any custom guest hardware option). See the troubleshooting page about this.
- are stored inside a disk snapshot
qcow2file.
VM Hardware options
By default, when you start a snapshot, it is launched with the VM options (RAM size, network, custom QEMU options) that were provided during the Register VM step. You can override these options for this specific snapshot in the Running the VM section. Overridden options for a snapshot will be applied when starting the VM on this snapshot. You can restore an option to its VM value by unchecking the checkbox associated to this option.
What preparing a snapshot is
When importing a VM, the Wizard "prepares" the snapshot. This important operation does:
- Open the VM disk image (the current state of the disk snapshot),
- Parse it for binary & other relevant files,
- Extract these files over to the "prepared file system" for later use by the REVEN server.
The extracted files notably have two important uses:
- When displaying code from a binary in a Windows scenario, REVEN will use the real binary file in the prepared file system to identify which PDB to extract symbols from.
- Similarly in Linux scenarios, symbols will be extracted from the prepared file system, either from:
- The binary being run,
- A debug symbol file.
How to prepare a snapshot
IMPORTANT: you should prepare the snapshot again after installing new software to a VM to make sure the right binaries are accessible to the REVEN server.
You can prepare a snapshot from a VM's snapshot page:
- Browse to the VM manager tab, then click on a VM's snapshot to open its page,
- Locate the
Prepare the Snapshotsection at the top, - If your snapshot is already prepared and you want to force the preparation again, click on
Unprepareand wait for the operation to finish, - Click on the
Preparebutton.
See more below about Snapshots statuses after a Prepare operation.
Disk snapshot statuses
Disk snapshots can have the following statuses in the Project Manager, relating to OSSI availability:
: Prepared, means the filesystem has been extracted from the snapshot.
: Inherited, means the snapshot "inherits" the OSSI of a parent snapshot. NOTE: If the current snapshot contains new binaries compared to its parent snapshot, OSSI may not be available for these binaries in the Analysis stage. Should you need this OSSI, launch a Prepare operation on the current snapshot.
: Not prepared, means no Prepare operation has occurred for this snapshot. Therefore, no OSSI is available for this snapshot. Without OSSI, binary and symbol names will not be available in the Analysis stage.
Using PDBs on air-gapped networks
REVEN Enterprise edition can be deployed on fully air-gapped networks, where no Internet connection is available. In this situation, the default PDBs servers (Microsoft's and others) the REVEN configuration points to will not be accessible, so manual operations are required to retrieve these files.
- Using a locally-accessible PDB server
- Temporarily connecting the server to the Internet
- Retrieving PDBs from a list built by REVEN
- Retrieving PDBs manually
- About REVEN's local PDB store
- A note about mandatory PDBs
Using a locally-accessible PDB server
By default, REVEN's configuration points to PDB servers accessible on the Internet. However, it is frequent for users working on an air-gapped network to have their own PDB server accessible over HTTP acting as a mirror for use with tools such as WinDbg or IDA. If such is your case, you can edit the list of PDB server REVEN uses, see the documentation about this.
Temporarily connecting the server to the Internet
If you don't have a local PDB mirror, then by far the easiest option is to temporarily connect your REVEN instance to the Internet when you add a new VM or install significant software. Here is the general procedure to follow:
- Open the snapshot's page in the Project Manager (click on the snapshot's name in the VM Manager page)
- Locate the "Prepare the Snapshot" section at the top.
- If your snapshot is not yet prepared, click on "Prepare" and wait for the operation to finish.
- Now connect the REVEN server to the Internet
- Click on "Show advanced", then on "Download PDB files". This will effectively download all possible PDBs from the prepared file system.
- You can monitor and control the
PDB downloadtask in theTasks & Sessionstab.
Note that if the software you want to analyze can be augmented with PDBs (such as Chrome), make sure it is installed prior to preparing the snapshot. See advanced snapshot management for more information.
Retrieving PDBs from a list built by REVEN
You can apply the same procedure just above but without an Internet connection: at the end of the PDB download task, you will get a list of PDBs REVEN could not successfully download. Copy this list over to an Internet-capable machine and use it to download all PDBs yourself.
Once you have your set of PDBs, copy them over to REVEN's local PDB store.
Retrieving PDBs manually
Finally if you have no other option, you can use the bin/rabin2 tool provided with REVEN to download PDBs from a binary:
RABIN2_PDBSERVER="<pdb server>" RABIN2_SYMSTORE="<path to the local PDB store>" bin/rabin2 -PP "<binary file>"
Note you have to copy the binary file from the VM over to an Internet-capable machine by your own means. Once you have your set of PDBs, copy them over to REVEN's local PDB store.
About REVEN's local PDB store
During normal operation, REVEN first looks for PDBs in its local PDB store. This store is common to every scenario of a REVEN installation. Therefore, a last resort option on an air-gapped network is to populate the store manually on the server's disk with a set of PDBs that you would have downloaded on an separate network.
The store's path is defined in the settings files, its default path is ~/.local/share/reven/symbols on both Docker and native installations.
The store structure respects the following format:
<PDB filename>/<GUID><AGE>/<PDB filename>
example:
hal.pdb
 └── 81C1AF690083498BA941D5EC628CDCF41
     └── hal.pdb
ntdll.pdb
 └── 4E4F50879F8345499DAE85935D2391CE1
     └── ntdll.pdb
ntkrnlmp.pdb
 ├── 0DE6DC238E194BB78608D54B1E6FA3791
 │   └── ntkrnlmp.pdb
 ├── 23CA40E78F5F4BF9A6B2929BC6A5597D1
 │   └── ntkrnlmp.pdb
 ├── 2980EE566EE240BAA4CC403AB766D2651
 │   └── ntkrnlmp.pdb
 └── 83DB42404EFD4AB6AFB6FA864B700CB31
     └── ntkrnlmp.pdb
This structure is exactly the same as Microsoft's PDB store, and makes it easy to merge two PDB sets together.
A note about mandatory PDBs
While in general PDBs are only used for displaying more debug symbols when analyzing a binary, certain PDBs are necessary for REVEN features. You should really make sure they are available if you download PDBs manually.
| Binary | PDB Necessary for |
|---|---|
| kernel (ntoskrnl.exe or other names) | All OSSI |
| kernelbase.dll | Binary auto record |
| ntdll.dll | Binary auto record |
| wow64.dll | Binary auto record of a 32-bit program in a 64-bit machine |
NOTE: Having the right PDB for the kernel being run is mandatory for anything related to OSSIs in REVEN. There must be an exact GUID match between the kernel and its PDB.
NOTE: Outside of the PDBs mentionned in the table above, if a PDB is missing, REVEN will simply fetch the symbols available in the PE binary instead.
Troubleshooting
Help! My snapshot doesn't load!
There are a few situations that will prevent a snapshot from loading. In all cases, you can go to the list of Sessions in the Project Manager to get the log of what went wrong. Several checks can be done, depending on the type of snapshot concerned.
Live snapshots
If, after restoring a live snapshot, you see one of the following symptoms, it means there is an issue with restoring the live snapshot:
- Display is stuck with message
Guest has not initialized the display (yet) - It looks like the snapshot is restored but the VM is frozen
- It looks like the snapshot is restored but the OS crashes soon after.
The most common issue is an incompatibility with the hardware options selected when the live snapshot was created, and the ones selected when restoring the live snapshot. See What you need to know and Advanced snapshot management for more details.
As a result, you should make sure the selected options match, including KVM mode and custom options. As a convenience, the live snapshots's name contains a summary of the value of common options.
Disk snapshots
- Has the VM been properly shutdown? (try
Shift + ClickonShutdownin windows to force a full shutdown instead of a hybrid) - Has the parent disk snapshot been modified? If so, children snapshots become unusable!
Note that in some cases your disk snapshot may become corrupted leading to the error Image is corrupt; cannot be opened read/write when launching QEMU. It can sometimes occur when having heavy disk I/O or killing QEMU.
To assert the level of corruption of your snapshot you can use the command qemu-img check /path/to/your/snapshot.qcow2. A possible fix is to ask qemu-img to fix the corruption qemu-img check -r all /path/to/your/snapshot.qcow2.
Managing scenarios
- Configure and record a scenario.
- Replay the scenario and generate analysis data.
- You can now Analyze the scenario with the Axion GUI.
- You can also Import or export scenario.
Then, in the Scenario Manager:
- Create a new scenario, selecting the previously created disk snapshot.
- Load the previously created live snapshot.
- Record your trace.
- Force shutdown the VM.
NOTE: At this point, the disk snapshot contains an OS that didn't properly shutdown: it is usually not an issue because restoring the live snapshot will overwrite this state, but booting the VM from the disk snapshot itself will likely trigger any disk verification process the guest OS may have.
NOTE: You can save live snapshot during scenario creation as well, if necessary.
NOTE: For simpler situations, you might have a few live snapshots in emulation mode for various use cases: one with network, one without, etc.
Finally, check out the Troubleshooting page if you have errors.
Creating a new scenario
Once you have VMs and Snapshots all set up, you are ready to create new analysis scenarios.
Creating a scenario involves the following steps:
- Selecting a snapshot to start from, naming and describing the scenario.
- Listing files that must be loaded on CD-ROM before the scenario recording.
- Recording the scenario:
- Starting the VM / Snapshot.
- Starting recording.
- Performing scenario operations in the VM.
- Stopping recording.
- Stopping the VM / Snapshot.
More on scenario recording in QEMU
There are multiple approaches you can take to recording a scenario in QEMU:
- Coarsly by triggering the start and stop operations via the Web user interface buttons. This is good for simple scenarios, or general testing.
- More finely, using Debugger-assisted recording with WinDbg (Windows only).
- Automatically - see the Automatic Recording page (Enterprise edition on Windows 10 x64 only).
By default, for a record, the VM is launched with the options values of the selected snapshot (ram size, network, custom QEMU options). It is possible to override snapshot options for this specific record before launching the VM. In the Web user interface there are checkboxes and fields that allow to modify the ram size, enable or disable the network or add (QEMU) custom options.
Recording a scenario in VirtualBox
With VirtualBox, start and stop operations are triggered via custom keys, from within the VM:
Inside the VM:
- Type F9 to enable custom keys which are used to start or stop a recording.
- Type F6 or Enter to start recording.
- Type F7 to stop recording. This also stops the VM and closes VirtualBox.
NOTE: Custom keys can be disabled typing F10.
Replaying a scenario
Recording a scenario saves a minimum set of events which are necessary to later reproduce its complete execution trace. The goal here is to minimize the recording overhead.
The Replay stage allows to:
- Retrieve the whole set of events that occured during a scenario.
- Compute new data from this set of events to provide advanced analysis features.
Several sets of data, called resources in the Project Manager, can be replayed from a recording, each corresponding to some analysis feature:
- Trace data
- Memory History data
- Strings data
- Backtrace data
- Binary and symbol indexing data
- Framebuffer data
Learn more about Feature and Resources.
For QEMU scenario only, the replay page allows to add custom options to the replay command (for advanced users only). By default, these options have the same value than the ones used during the record. The ram size is not editable at this step since the replay requires the same amount of ram as the record. When a resource has been generated with custom options, all remaining resources have to be generated with these same options. If you don't want to use custom options anymore, then you should remove the already generated resources that used custom options.
Replaying a scenario will take minutes to hours depending on:
- The REVEN server hardware resources.
- The scenario duration and computing intensity.
- The number of features replayed.
The screenshot below shows the Replay statistics for a QEMU scenario with 2.3 billions transitions on a server equipped with an Intel(r) Xeon(r) CPU E5-2643 v4 @ 3.4GHz and 264GB RAM.
NOTE: The total replay duration is less than the sum of all resource replays since some of them are run in parallel.
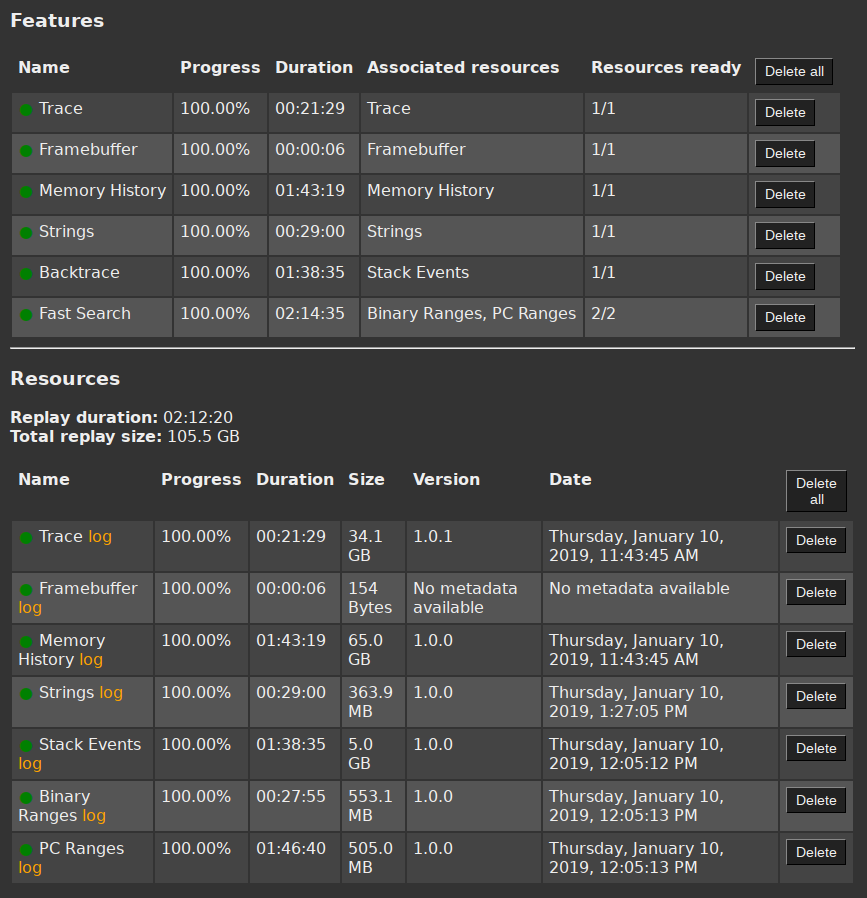
Importing & exporting a scenario
A recorded scenario can be exported, with or without some associated replayed resources. The resulting archive can then be shared with other REVEN users or stored away to free space on your working disk.
By default, the folder where archive files are stored is ~/Reven2/Archives. It is user-definable in the Project Manager settings file via the variable QUASAR_ARCHIVES_PATH (see the storage doc).
Conversely, all archive files stored in the QUASAR_ARCHIVES_PATH can be imported as scenarios to be analyzed with REVEN.
A typical scenario archive will usually take between 500 MB and 1 GB. For instance, the scenario presented in the article Analysing CVE-2020-15999 - buffer overflow in Chrome requires about 30 GB of disk space when fully replayed, but its archive is only about 750 MB.
Exporting
To export a scenario:
- First, open your scenario's "Details" page. You can find it by clicking the scenario's name in the scenario list.
- Click "Export".
- The export page allows you to select what you want to export. You should keep the defaults.
- The "OSSI" is selected by default, and highly recommended:
- If not selected, you will not be able to get symbols after importing the archive.
- If you cannot select it, you should first replay the OSSI on your scenario and come back to the export page.
- See below for more details on the other items.
- The "OSSI" is selected by default, and highly recommended:
- Click on "Export the scenario".
- Wait for the operation to finish.
Once the export operation is done, you can access the resulting archive:
- Either download it with the "Download" button on the export task log.
- Or locate it on the server at
QUASAR_ARCHIVES_PATH(see above).
NOTES:
- The original scenario is not deleted after the export task succeeds.
- Exporting a scenario a second time will overwrite the scenario's previous archive.
- You cannot export a scenario while recording, replaying, importing or exporting it.
Importing
The Project Manager can import archives that were previously exported using the above method. This operation will create a new scenario, and extract the archive into it.
NOTE: The Project Manager can only find archives stored in the server's QUASAR_ARCHIVES_PATH folder. Therefore, you must manually copy external archives (e.g. from Tetrane's website or an other server) into this folder. Currently, the Project Manager does not propose to upload external archives.
To import a scenario:
- If you wish to import a scenario exported from another server:
- First, copy the archive to your
QUASAR_ARCHIVES_PATHfolder. Its default path is~/Reven2/Archives, and this folder may need to be created first (see the storage doc).
- First, copy the archive to your
- In the "Scenario List" page, click on "Import from archive".
- Use the combo-box to select the archive you want to import.
- If you cannot see it, make sure it is in the correct
QUASAR_ARCHIVES_PATH.
- If you cannot see it, make sure it is in the correct
- Click on "Import".
- Wait for the task to finish.
- Archives usually do not contain all replayable resources: you should open the Replay page of the newly created scenario and click on "Replay" all.
NOTES:
- The resulting scenario is a "Snapshot-less scenario", because it is not linked to a particular VM anymore.
- You cannot overwrite the recording of a scenario from an imported archive.
- As soon as you start importing an archive, its scenario becomes visible in the scenario list. However, as long as it is being imported, all actions on the scenario will be disabled.
About exported resources
Here are more details about the resources you can select for export in a scenario:
- The record: it is mandatory, you cannot export a scenario without the original record included in the archive.
- The replay: resources generated by a replay are optional. They can be regenerated after the import. We do not recommend keeping them since they add significant overhead to the archive size, which also increases the time necessary to export it.
- The ossi: It is highly recommended to include the OS-specific information. If you don't include them, you won't be able to retrieve OSSI (like symbols) when you will import the archive.
- The light PDBs: Light PDBs contain only the PDBs needed for the scenario. It is not mandatory, as you should be able to download them from the original sources again when importing the archive. However they are recommended: including them when exporting a scenario is a convenience for users who are not connected to the Internet. Moreover, PDBs could get deleted from sources out of your control. Finally, if the scenario requires custom PDBs (for binaries you compiled), then you should include them in the archive.
- The user data contains files useful for the scenario, with user-generated information (bookmarks, scripts, readme, ...). You certainly want to include this information in an exported archive and retrieve it when importing one.
The archive will also always include information about the scenario (name, type, os, archi, ...) and REVEN's version, necessary for later importing.
Some resources are immutable after importing an archive, because they cannot be regenerated. Hence, they cannot be deleted in the imported scenario. For instance, the OSSI's light filesystem is an immutable resource because it depends on the snapshot.
Replay stage: Features & Resources
After recording a scenario, you will need to replay it in order to generate data required by the features you will use during the analysis stage.
In the replay stage, you are presented with a list of available REVEN's features. Resources data needed for each feature are discoverable by clicking on the feature row. In some features, there are also actions available.
By default, everything is selected.
NOTE: Axion cannot be launched if no trace data is available.
Features, Resources and Actions
Features match actual features available in Axion. For example, in order to visualize the Framebuffer in the Axion GUI, you will need to replay the Framebuffer feature during the replay stage.
Resources refer to the file(s) and data generated during the replay of a feature
in the replay stage. For example, the Backtrace feature replay output comprises
the "Stack Events" resource. Stack events regroup every data needed to display
the backtrace in Axion.
Actions are steps related to a feature that do not produce a resource. As such, these actions can be repeated.
For example, a current action is the Download light PDBs action, that allows to download external PDB. It can be useful to repeat this action if the symserver changes (e.g., contains new PDBs).
As such, an action is not necessarily mandatory to use a feature, but may improve the completeness of the feature (e.g., having more PDBs allows to resolve more symbols).
Available features and associated resources
The features present in the replay stage of the Project Manager are listed below:
| Feature | Resource(s) | Dependencies | Description |
|---|---|---|---|
| Trace | Trace |
| Contains all the transitions occurring during a scenario. |
| Framebuffer | Metadata |
| Allows displaying the framebuffer for any transition in a scenario in Axion. |
| OSSI | Light Filesystem & Kernel Description |
| Contains all the information to retrieve the OS-specific information in the Trace. |
| Memory History | Memory History |
| Contains every read and write memory access in a Trace. |
| Strings | Strings |
| Contains strings dynamically built during a scenario. |
| Backtrace | Stack Events |
| Contains the active stack frames for any transition in a Trace. |
| Fast search | OSSI ranges & PC ranges |
| Provides indexes to speed up the Search feature. |
| Filters | OSSI ranges |
| Provides indexes to filter the trace. |
NOTE: Some features can be immutable. This means they cannot be generated or deleted (without deleting the scenario).
For example, in a Snapshot-less scenario (e.g: imported scenario), the light filesystem resource is immutable, as we wouldn't be able to regenerate it, since light filesystem generation requires a snapshot.
Resources & Features statuses
Features and Resources can have the following statuses:
: Compatible, means the resource is up-to-date and can be used with the current REVEN version.
: Ready, means the resource is not versioned then can be used with the current REVEN version.
: Compatible but generated with a different REVEN version, means the resource is not up-to-date but can still be used with the current REVEN version. To make the resource up-to-date, you need to replay it, doing so you will benefit from bug fixes and minor updates.
: Not compatible, means the resource is not compatible with the current REVEN version because of a breaking change. The current REVEN server will not be able to read it. You will need to re-generate the resource to make the associated feature available again.
: Replay failed, means the resource is not available because a problem occurred during the replay. Please consult the replay logs and/or try to replay the resource again.
: Replaying, means the resource is being generated.
: Pending, means the resource generation is waiting for some system resources or a dependent data resource to be available.
: Not generated, means the resource is not generated yet.
: Deprecated, means the resource is deprecated and won't be used by REVEN anymore. You can delete it.
Actions statuses
Actions can have the following statuses:
: Success, means the action was ran successfuly once and could be re-run.
: Failure, means the action encountered a problem during the execution. Please consult the replay logs and/or try to replay the action again.
: Running, means the action is being executed.
: Pending, means the action is waiting for some system resources or a dependent data resource to be available.
: Not ran, means the action wasn't ran at all.
Troubleshooting
My replay failed
There could be multiple reasons:
- You are outside of the perimeter of what can be recorded (see below)
- You have hit a bug, in that case, please contact the support.
Depending on the resource that failed replaying, it is possible you can still work on your trace. The only mandatory resource is the Trace.
If the Trace resource fails, you can also try to limit the number of instructions to stop the replay before it fails.
What cannot be recorded
In practice, the record / replay stack REVEN uses does have some technical limitations, detailed below. If you try to record one of those situations, you are outside the supported perimeter.
NOTE: you are very unlikely to hit one of these situations if you record a scenario after the VM has reached its login screen.
- REVEN does not handle scenarios where the CPU is not at least in protected mode with virtual memory configured. This prevent recording BIOS execution, or anything in real mode during the boot.
- Certain changes to the CPU or MMU configuration, such as those happening during the boot of the OS, cause the replay operation to fail. As a result, you cannot record the entire boot process, such as from the kernel entry point to the login screen in windows. You can still record parts of it, as long as you don't reach code that performs one of those unhandled significant configuration changes.
Axion - User guide
Axion is REVEN's GUI for scenario analysis. It helps reverse-engineer complex programs and situations.
Installing Axion
Axion is comprised in the REVEN package for the Debian 10 Buster x64 servers. Axion is also available as an AppImage package. Please refer to the REVEN installation guide for further guidance on deploying these packages.
Using Axion
Axion can be launched from the Project Manager REVEN web GUI, on scenarios that have appropriate data available for analysis. Please refer to the REVEN Project Manager User Guide for further guidance on preparing a scenario for analysis by Axion.
Axion can also be launched manually on the REVEN server itself or using the AppImage from a remote client.
Core Analysis views
Axion provides several views to analyze a scenario.
- Trace view
- Trace Filter view
- CPU view
- OS Specific Information (OSSI)
- Calltree view
- Backtrace view
- Search view
- Memory - Hexdump view
- Memory - Memory history view
- Memory - Physical history view
- Framebuffer view
- Taint view
Tool views
- Logs
- Bookmarks
Visit the Axion Views page for more details on how to use each view.
Trace navigation
Visit the Trace Navigation page for more details on how to navigate the trace in Axion.
Axion synchronization
You can synchronize Axion with Python clients, for instance to select a transition in Axion from Python.
Visit the Axion synchronization page for more details on this feature.
Plug-ins
OSSI
One very important aspect of analyzing a scenario's trace involves mapping the low level transitions in the trace to higher level OS Specific Information (OSSI) such as binary names and symbol names.
More information about OSSI environment setup can be found here.
In Axion, OSSI is provided in the following views:
Binary information
Binary information is all information related to a segment of memory that is mapped into a process address space. Most of the time, a segment of memory is a binary loaded in memory but it can be a stack, a heap, a part of memory allocated by a process, etc.
A segment of memory is valid for a process and defined by a base address (=start address), a size and a name.
Information is derived from the in-memory OS process map.
If the binary information related to an address is not available, unknown will be displayed. The cause of an unknown information can be that:
- The binary mapping was not found in the
_PEB_LDR_DATAstructure of the running process. - The execution of some code on the heap, on the stack or after a copy in memory.
- The VM used to record the scenario has the
KPTI protectionenabled.
Symbol information
Symbols are part of binary information. A symbol is linked to a memory segment and it is defined by a relative virtual address (RVA) and a name.
A RVA is an offset from the base address of the memory segment. Using a RVA instead of a virtual memory address allows to be independent on where the memory segment is mapped in the process address space.
The sources of symbol information are:
- The binary files.
- The PDB files.
If the symbol related to an address is not available, unknown will be displayed.
Symbol name format
The following example explains what will be displayed in various situations.
         Process Address
             Space
        cr3 = 0x078c0000

         |             |
         |             |                     Example.exe
         |             |                 base address = 0x400000
         |             |
         |             |                                      rva     symbol
 0x400000|-------------|                    .-------------.   0x0      nil
         |             |                    |             |
         |             |                    |             |
         |             |                    |             |
         | Example.exe |                    |-------------|   0x300    Sym1
         |             |         =>         |             |
         |             |                    |             |
         |             |                    |-------------|   0x1200   Sym2
         |             |                    |             |
         |             |                    |             |
         |             |                    |             |
         |             |                    |             |
 0x402000|-------------|                    '-------------'   0x2000
         |             |
         |             |
         |             |
         |             |
Possible formats for a symbol's name are:
[0x400000, 0x400300[=>Example.exe_<rva>.0x400300=>Sym1.]0x400300, 0x401200[=>Sym1+0x<offset from rva>.0x401200=>Sym2.]0x401200, 0x402000[=>Sym2+0x<offset from rva>.
NOTE: Currently, in REVEN, it is not possible to define custom symbols in a scenario.
Axion Views
- Trace view
- Trace Filter view
- Search view
- Framebuffer view
- Calltree view
- Backtrace view
- Trampolines
- CPU view
- Hexdump view
- Strings view
- Taint view
- Bookmarks view
- Memory watchers view
- Logs view
Trace view
The Trace view represents the flow of system state transitions in the
recorded scenario under analysis.
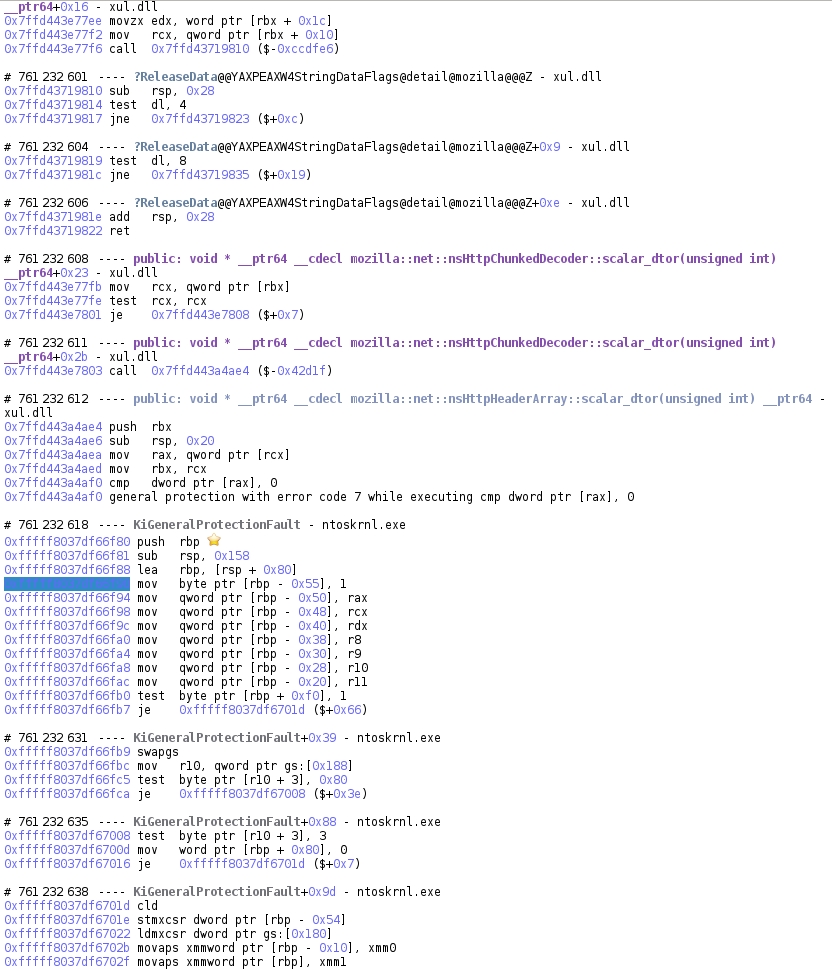
Most of the time, a transition is simply an executed instruction. However, sometimes a transition can be:
- A partially executed instruction (normal execution of the instruction was interrupted by a fault).
- An interrupt.
- A fault or an exception.
Transitions are numbered from 0, the first transition in the trace, to T, the last transition in the trace.
The trace is divided into basic blocks. Basic blocks contain transitions
occurring on contiguous code addresses. In the Trace view, each basic block
is identified by the number of its first transition, the name of the
symbol in which the transition occurs and the offset within that symbol.
NOTE: symbol information is only displayed if the OSSI information sources have been previously configured for the scenario's VM and files.
Tips
- You can select any item in the trace, such as an instruction or a register for example. All similar items will be displayed with a yellow background.
- You can select any operand in the trace and, if appropriate, open a
corresponding
Hexdumpview.
Trace Filter view
The Trace Filter view represents a high level view used to filter the trace.
It displays a list of all the processes present in the trace.
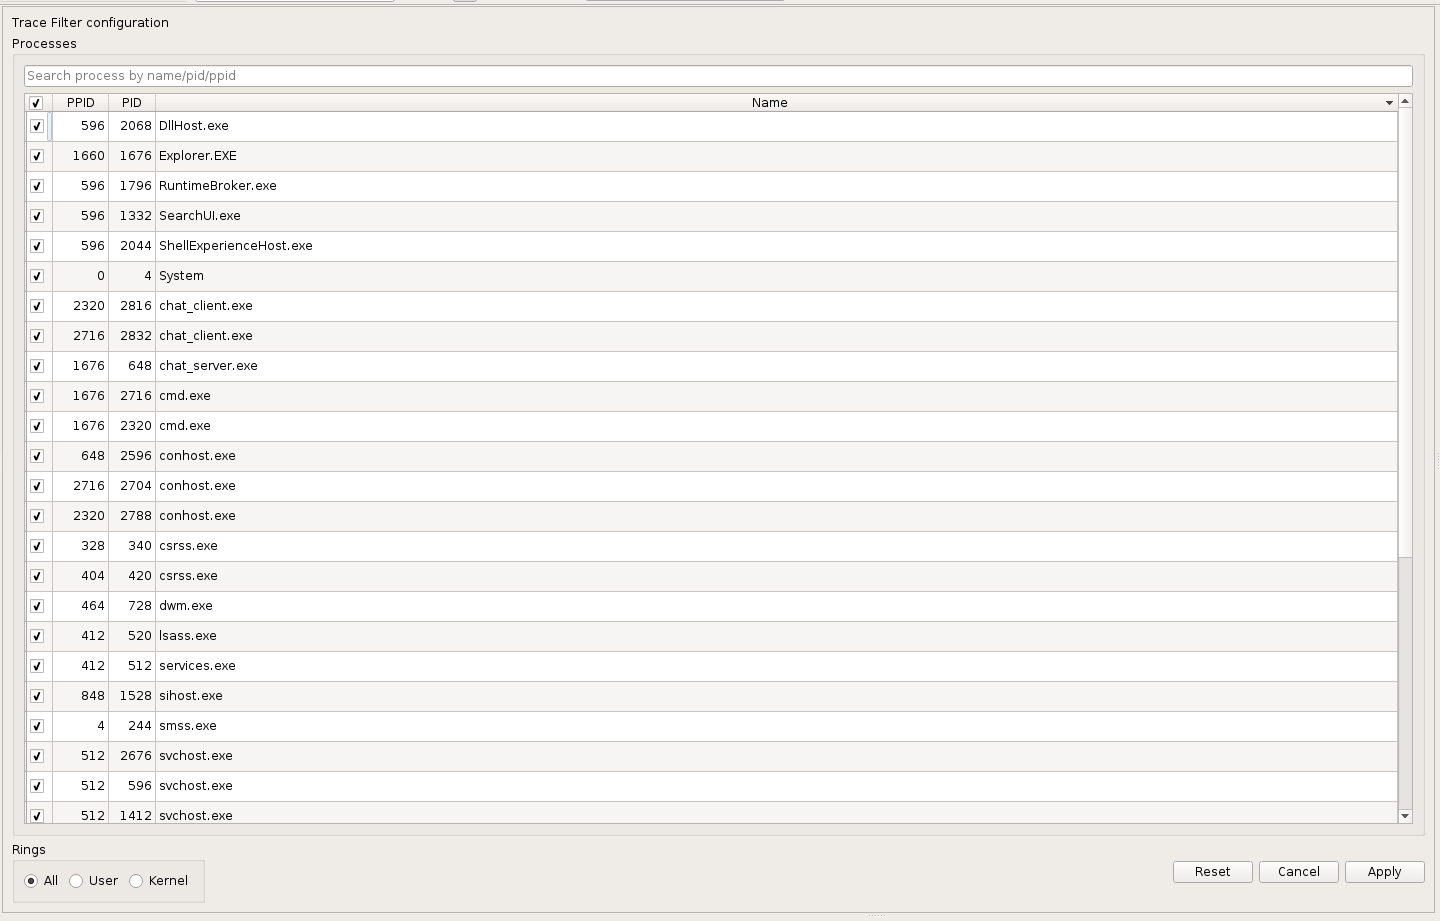
The trace can be filtered by checking/unchecking the processes in the list,
and by selecting which rings are of interest: User space, Kernel space, or both.
In the Trace view, transitions that do not match the filter are displayed with a gray
background.
In the Trace view, navigation from one transition matching the filter to the next one,
skipping the transitions outside the filter, can be done either using the
filter navigation buttons in the toolbar, or the dedicated shortcuts (F6/F7 by default).
It is also possible to move from a range of transitions matching the filter to the previous/next range by using the
filter range navigation buttons in the toolbar, or the dedicated shortcuts (Alt+F6/Alt+F7 by default).
Trace filter toolbar:

A filtered trace view is displayed as the following:
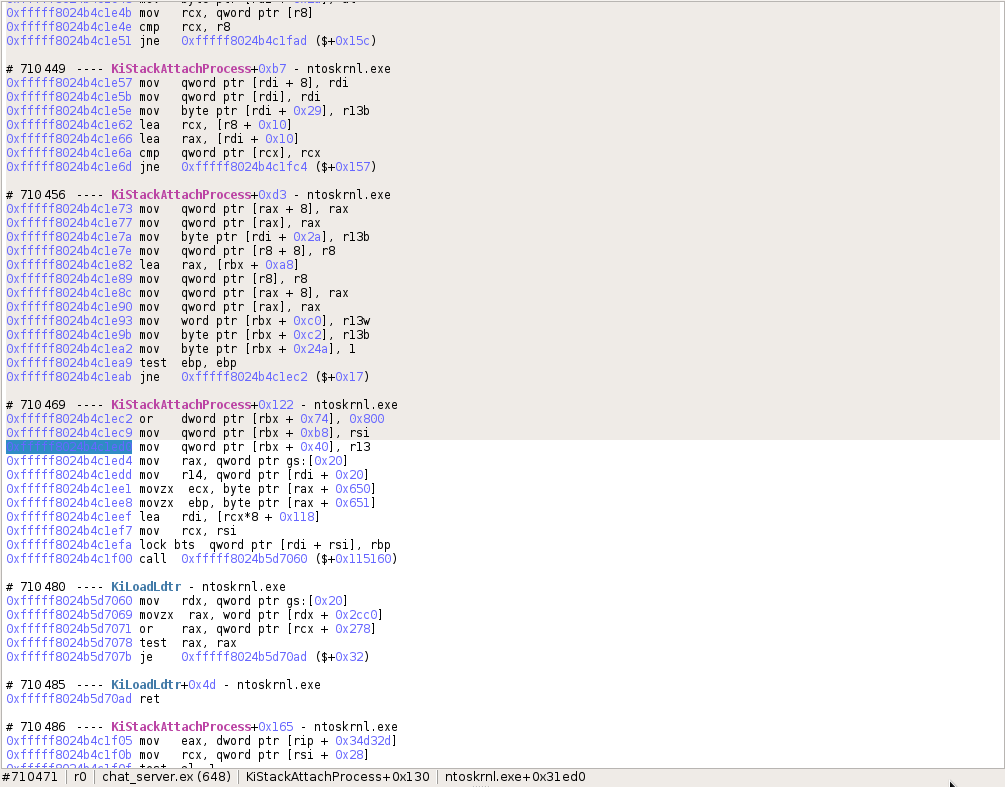
Search view
The Search view allows to search some points of interest in the Trace
view. Points of interests can be:
- Any transition.
- A transition with a given code address executed.
- A transition with a given binary executed.
- A transition with a given symbol executed.
- A transition with a call to a given symbol.
The Search view is composed of:
- A filter form to select points of interest to search.
- A zoomable timeline representing the whole set of transitions in the scenario and displaying where results are found in the trace.
- An exhaustive list of results.
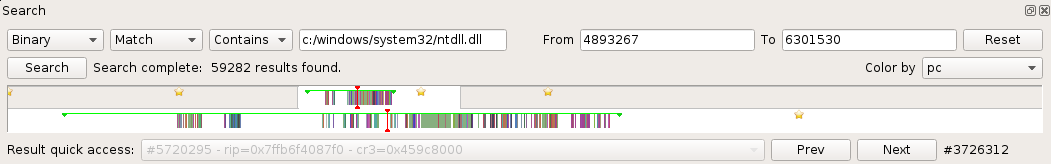
Using the timeline
Going to some place in the trace
The Timeline allows to go directly to some place in the trace just by
clicking on it. A vertical red bar represents the current location in the Trace view.
Manipulating the zoom
The Timeline can be zoomed-in/out using:
- the keyboard with the zoom-in/zoom-out sequence key, usually Ctrl++/Ctrl+-.
- the mouse with Ctrl+WheelUp/Ctrl+WheelDown and Left-click + drag and drop to select the zoom area.
When zoomed in, the background of the zoomed area is white.
The zoomed area can be translated left or right using:
- the keyboard with the Up key, the Left key or the PageUp key (faster) to move to the left and the Down key, the Right key and the PageDown key (faster) to move to the right.
- the mouse with Wheel Up to move to the left and Wheel Down to move to the right.
The zoom can be reset using Ctrl+0.
Searching a sub-range of the trace
On large traces, a sub-range can be selected in the Timeline to reduce the
scope of a search:
- Right-click + drag and drop in the timeline: a green line represents the currently defined sub-range.
Going to a bookmark
The Timeline also displays bookmarks set in the Trace. Click on the
bookmark icon in the timeline to get to the bookmark in the trace.
Searching and browsing some points of interest
- Fill the search form with your search parameters.
- Click the Search button and wait for the results to appear in the timeline and in the result dropbox.
Framebuffer view
The Framebuffer view provides a view of the machine's screen state for a
given transition selected in the Trace view.
NOTE: the Metadata replay must have been run for the Framebuffer view to be available.
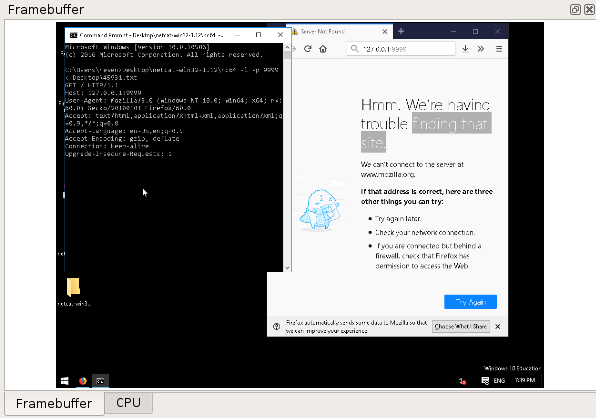
Calltree view
The Calltree view provides a tree representation of the ancestor and sibling calls
around the currently selected transition in the Trace view. This calltree is dependent
on the stack currently in use, and as such is local to the current process and thread.
The following is a code block with its corresponding calltree. The calltree widget adds a
hole item when there are many siblings. This hole item contains buttons that can be used
to request more siblings. In the example below, the hole item represents hidden calls
to function_bottom, made by function_b in a for loop.
|
|
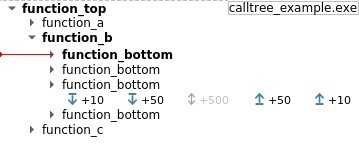
The Calltree view is initialized with a minimal call tree that can be enriched by the user.
List of actions available in the Calltree view:
- Display more sibling

- Display children

- Display more ancestors

The Calltree view displays several other important pieces of information:
- A horizontal red line representing the current selected transition.
- The calls belonging to the current backtrace are displayed with bold font.
- Binary names are displayed at the right side of the view. Only binary changes are displayed. The destination binary of a call is displayed beside the call if its children are hidden.
By default, the Calltree view is updated every time the active transition is changed.
This behavior can be disabled by clicking on the lock button  .
To re-enable it, click on the unlock button
.
To re-enable it, click on the unlock button  .
Only the tree will be locked, the location of the active transition and the current backtrace will still be updated.
Note that if the current transition is not using the stack where the call tree view is locked in,
no current transition will be displayed.
.
Only the tree will be locked, the location of the active transition and the current backtrace will still be updated.
Note that if the current transition is not using the stack where the call tree view is locked in,
no current transition will be displayed.
Double clicking on a call item will change the active transition to the one that make the call. This will not update the tree, even if the widget is unlocked.
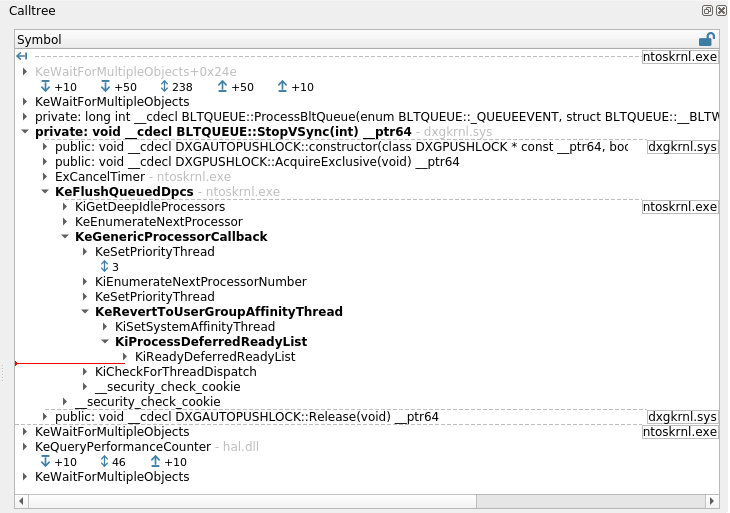
NOTE This view represents an attempt at rebuilding this information from the trace's content, and sometimes cannot be comprehensive. In that case, information from earliest calls may be missing or partial. Therefore double clicking certain entries is not possible.
NOTE: the Stack Events resource must have been replayed for the Calltree view
to be available.
Backtrace view
The Backtrace view provides a list of nested calls for the currently
selected transaction in the Trace view, akin to what would be
expected in a debugger. This backtrace is dependent on the stack currently
in use, and as such is local to the current process and thread.
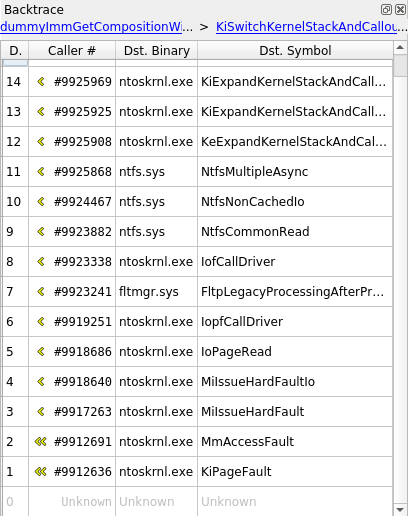
On the upper part of the widget are two links which, when possible, provide a quick way to navigate between stack switches (i.e. when the stack pointer points to a different stack) - these moments can be process switches, ring changes, process creations, etc. The left link points to the previous stack switch, and the right link to the next stack switch.
Below these links is a list of calls, sorted from latest to earliest. You can double click an entry to get to that call.
NOTE This view represents an attempt at rebuilding this information from the trace's content, and sometimes cannot be comprehensive. In that case, information from earliest calls may be missing or partial. Therefore double clicking certain entries is not possible.
NOTE: the Stack Events resource must have been replayed for the Backtrace view
to be available.
Trampolines
The backtrace as well as the Calltree widgets support trampoline calls. Trampolines are situations where the program calls an intermediary address that in turn jumps to the actual function code. See an example below:
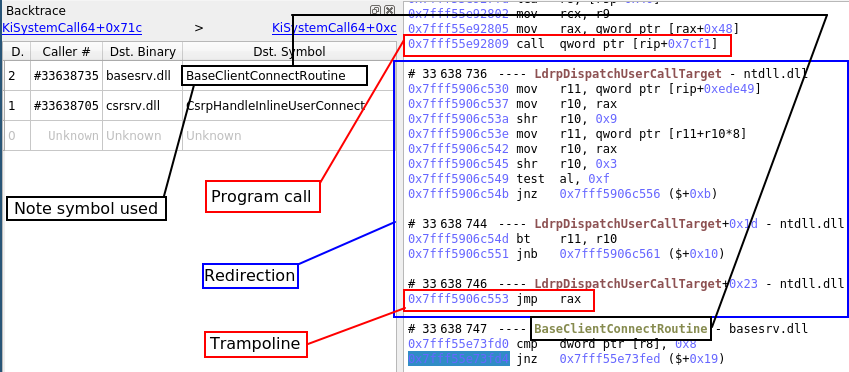
In this case, the selected transition is after both the call the trampoline jmp, so the backtrace displays the target function. However, if the selected transition is between the call and the trampoline jmp, the backtrace will show the call destination:
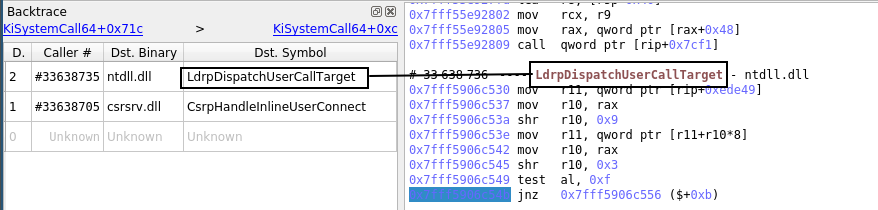
The detection of these trampolines is a heuristic and can sometimes be wrong. It is possible to ignore that information and only show the call destination by unchecking Replace calls with detected trampolines in Axion's Settings dialog window.
CPU view
The CPU view displays the state of CPU registers:
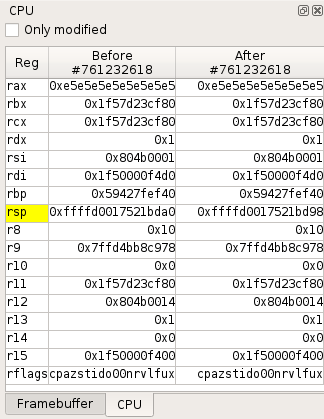
- By default, when a transition is selected in the
Traceview, it shows the CPU registers values before and after the transition. - From the
Timeline, you can also compare the CPU contexts between any two transitions in the trace.
Registers whose value has been modified by a transition or between two transitions are displayed with a yellow background. A checkbox allows you to display only modified registers.
The contextual menu provides the following actions:
- Select memory/register can be used to:
- Browse the register changes with the
Traceview Prev and Next buttons. - Open a new
Hexdumpview at the selected address.
- Browse the register changes with the
- Open an new
Hexdumpview. - Configure which registers must be displayed.
Hexdump view
The Hexdump view shows the content of the memory starting at a given address,
before or after a given transition in the trace.
By default, the Hexdump view that had the focus last will be reused when changing the memory location.
Several Hexdump views can also be opened at the same time for different memory
locations by clicking the "duplicate" button.
If a memory location is not mapped at the selected execution point, ? characters will be displayed instead of its
content.
The "previous/next" arrow buttons of a Hexdump view can be used to go back and forth between visited memory
locations, similar to a browser history.
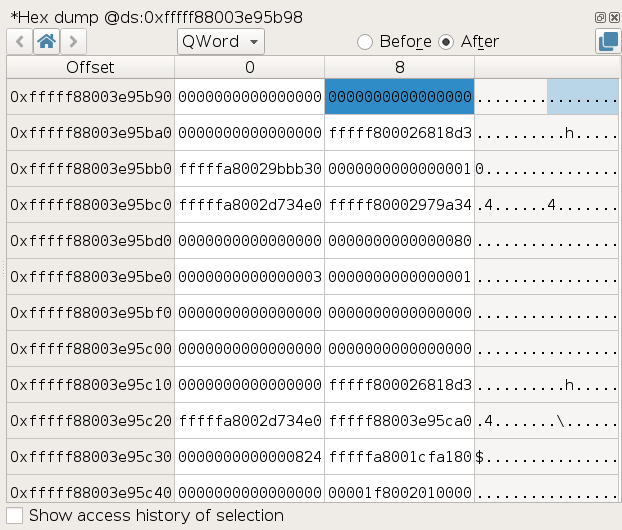
Memory history
The Memory History view displays the history of the accesses to the selected memory buffer.
NOTE: the Memory History replay must have been run for the Memory History data to be available.
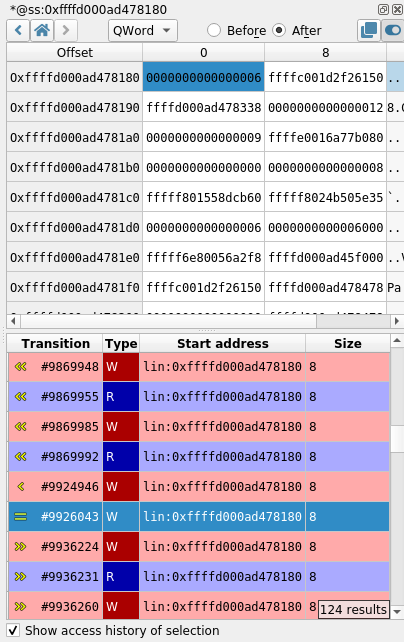
To display the history of a memory buffer:
- In a
Hexdumpview, select a Byte, DWord, QWord or any continuous range of memory. - Check Show access history of selection.
The list of Read and Write accesses to the buffer in the trace will then be displayed, centered on neighboring accesses. Each access is described with:
- A transition number in the trace.
- The access type R for read, W for write.
- The start address of the accessed memory.
- The size of the memory accessed.
To go to the transition in the trace corresponding to a given memory access, double-click its entry in the list.
Note this history reflects the activity of the physical region that the selected virtual area points to. This means that it can contain accesses to this area made through other virtual addresses if for example this area is:
- Shared with another process.
- Mapped elsewhere in the same process.
- Accessed via a physical address directly (by peripherals for instance).
- Reused later on in a different context.
Advanced details
There are a few specific details that are good to know, as they could otherwise be confusing:
- The history may not track internal accesses, such as those performed by the MMU itself while resolving accesses.
- The history does not track failed access attempts leading to page faults - unless if said access spans over more than one page and the first page is mapped but the rest is not, in which case there will be an entry for the first part of this access.
- What would intuitively be expected as a single access may appear sliced into consecutive smaller ones in various cases (access is more than 8 byte large, access spans over more than one page, etc.). This is tracer dependent.
- Certain instructions might generate counter-intuitive accesses: for instance,
BTS(bit test and set) may access a whole 8-byte region. Again, this is tracer dependent.
Strings view
The Strings view allows to display and filter all accessed memory buffers
in the trace that look like valid strings.
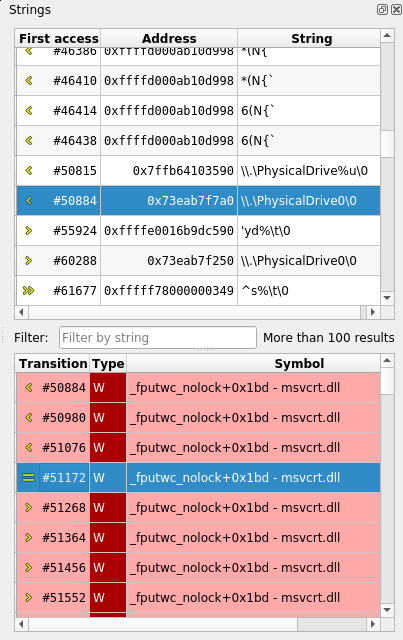
Each accessed buffer is described with:
- A transition number in the trace.
- The memory address of the buffer.
- The string value.
To view the access history of a buffer:
- Select the buffer in the list by clicking on it + Enter or double-clicking on it.
Each entry in the access history shows:
- A transition number in the trace. Double-click on the entry to get
to the transition in the
Traceview. - The access type R for read, W for write.
- The Symbol that performed the access, if known.
NOTE: the Strings replay must have been run for the Strings data to be available.
Taint view
The taint view allows to follow the data flow in the trace, either forward or backward.
The taint analysis automates the task of following some data from memory buffers and registers to other buffers. When performing a backward taint, it allows to find the origin of the tainted data.
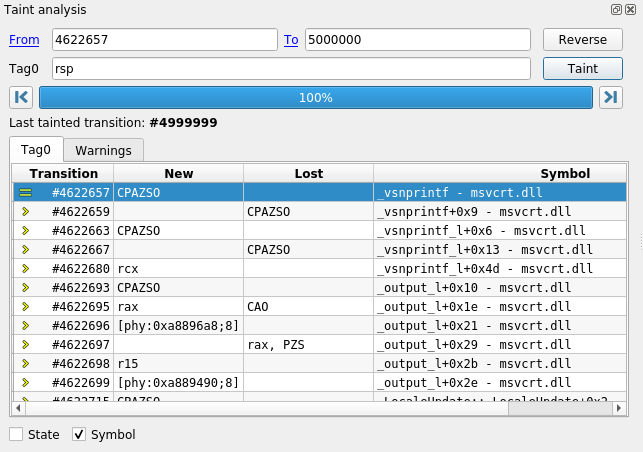
Specifying taint parameters
On the upper part of the widget are some input controls that allow to specify the taint parameters:
Fromindicates the first transition to taint.Toindicates the first transition not in the taint.Tag0indicates which data should be marked. For more information on what data can be tainted, please refer to the Taint data format section.
To perform a backward taint, the transition number in the To control should
be lower than in the From control (e.g., From = 2968405, To = 0).
Otherwise, the taint will be forward.
The Reverse button allows to swap the content of From and To, switching
between a forward and a backward taint.
Browsing results
On the middle part of the widget are several tabs. The Tag0 tab contains a table indicating all changes to tainted data that occurred during the taint.
You can use the |< and >| buttons around the progress bar to navigate directly to the start or the end of the taint. Note that if the taint is still being calculated, >| will take you to the latest known result.
To scroll within the table, use the mouse wheel or the keyboard Page Up / Page Down and arrow keys.
Note that the vertical scrollbar, while available when there are few results (in the hundreds), is not available on larger taints due to the way taint results are fetched.
Interpreting taint results
For each taint change in the list, the following information is provided:
Transition: the transition number of the change.New: shows data newly tainted.Lost: shows data that just lost taint. You can double click any entry in that list to display the transition where the change occurred in theTraceview.Symbol: if you checkedSymbolat the bottom of the widget, this column will show the transition's symbol as well.
NOTE: If you encounter any problem with the taint, you can check the Warnings tab to see some information about what happened during the taint process, in the neighborhood of displayed results. The warnings are also displayed as a clickable Warning icon next to the affected change in the change view. It is recommended to manually check changes when there is a warning icon displayed next to them.
The bottom part of the widget can be activated by checking the State
checkbox. It presents the current state of all tainted data at the transition that is currently selected in the trace.
NOTE: Although, internally, the taint works using physical addresses, the taint attempts to rebuild linear addresses in the taint state view. These linear addresses are clickable links that will open a new hexdump.
Taint data format
Various kinds of data can be tainted, here is a list:
- A register:
rax,rbx,eax,ah - A slice of register:
rax[0:3](is the same aseax),rax[2] - A byte of logical memory (implicit ds segment):
[0x4242]taintsds:0x4242 - A range of logical memory (implicit ds segment):
[0x4242; 2]taintsds:0x4242andds:0x4243 - A byte of logical memory (segment register):
[gs:0x4242]taintsgs:0x4242 - A range of logical memory (segment register):
[gs:0x4242; 2]taintsgs:0x4242andgs:0x4243 - A byte of logical memory (numeric segment index):
[0x23:0x4242]taints0x23:0x4242 - A range of logical memory (numeric segment index):
[0x23:0x4242; 2]taints0x23:0x4242and0x23:0x4243 - A byte of linear memory:
[lin:0x4242]taints linear address0x4242 - A range of linear memory:
[lin:0x4242; 2]taints linear addresses0x4242and0x4243 - A byte of physical memory:
[phy:0x4242]taints0x4242 - A range of physical memory:
[phy:0x4242; 2]taints0x4242and0x4243
NOTE: Several pieces of data can be tainted at once for each tag.
Example: Tag0: [0x2523808; 24], rax[4], rsp, [phy:0x1234f] will tag
ds:0x2523808 through ds:252381f, the fourth byte of rax, the entirety of
rsp and the physical byte at address 0x1234f.
Known limitations
- The taint may fail to propagate the taint on some instructions
(notably,
swapgs). The corresponding warning message isunable to lift instruction. - The taint may fail to propagate correctly on FPU instructions. The
corresponding warning message is
X87 FPU access in forward taint analysis. - The taint uses information obtained at the basic-block level to infer local
simplifications (for instance, it can infer that in the instruction sequence
{mov rax, rbx; xor rax, rbx}, thexoralways resetsraxto 0.). This inference may result in surprising displays in the table views, in backward (some register may lose the taint at one instruction, and some memory may "regain" the taint, apparently from nowhere). This is simply a display limitation and does not otherwise affect the correctness of the taint. - Tainting large ranges of memory (several MB) may result in a very slow taint that uses a lot of CPU.
- Only a single taint can run concurrently per REVEN server: currently, starting a second taint, even from a different Axion, will cancel the first running taint. Besides, if two Axion sessions are involved, the first Axion session may display mixed taint results.
Bookmarks view
The Bookmarks view lists bookmarks that you can create on any transition in
the trace, together with a name and a comment.
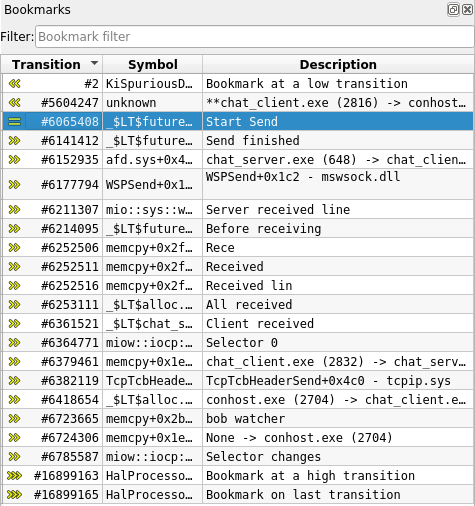
To create a bookmark:
- Select a transition in the
Trace view. - Click right to get to the contextual menu and select Add bookmark (or use the corresponding keyboard shortcut).
Memory watchers view
The Memory watchers view lists watchers that you can create on any virtual memory range in
the trace, together with a name, a basic type information and a description.
In order to be as light as possible during the analysis, the view only displays the watchers' name and their value in memory at the current transition in the trace. To see the description, click right to get the contextual menu and
select Edit.
The value in memory:
- will be updated at each transition change.
- is formatted according to the basic type the memory watcher is assigned.
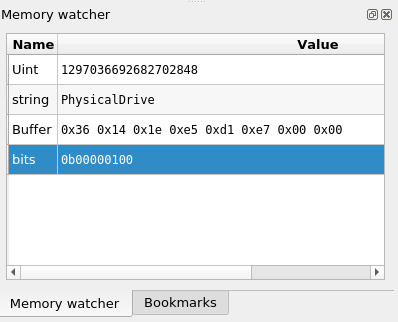
There is 3 ways to create a memory watcher:
-
Manual creation:
- Select the
Viewmenu - Select
Create Memory Watcher
- Select the
-
From a memory operand in the
Traceview:- Double click on an operand
- Click right to get the contextual menu and select
Watch memory
-
From a
Hexdumpview:- Select the memory range to watch.
- Click right to get the contextual menu and select
Watch memory
Logs view
The Logs view displays information, warning, error messages encountered by the Axion GUI.
It is a good idea to check this view when something unexpected occurs in the GUI.
Navigating the trace in Axion
Debugger-like navigation
Axion comes with a set of commands to browse the trace and set the currently selected transition in a debugger-like fashion: step into, step out, step over... forward and backward in the trace.
Overview
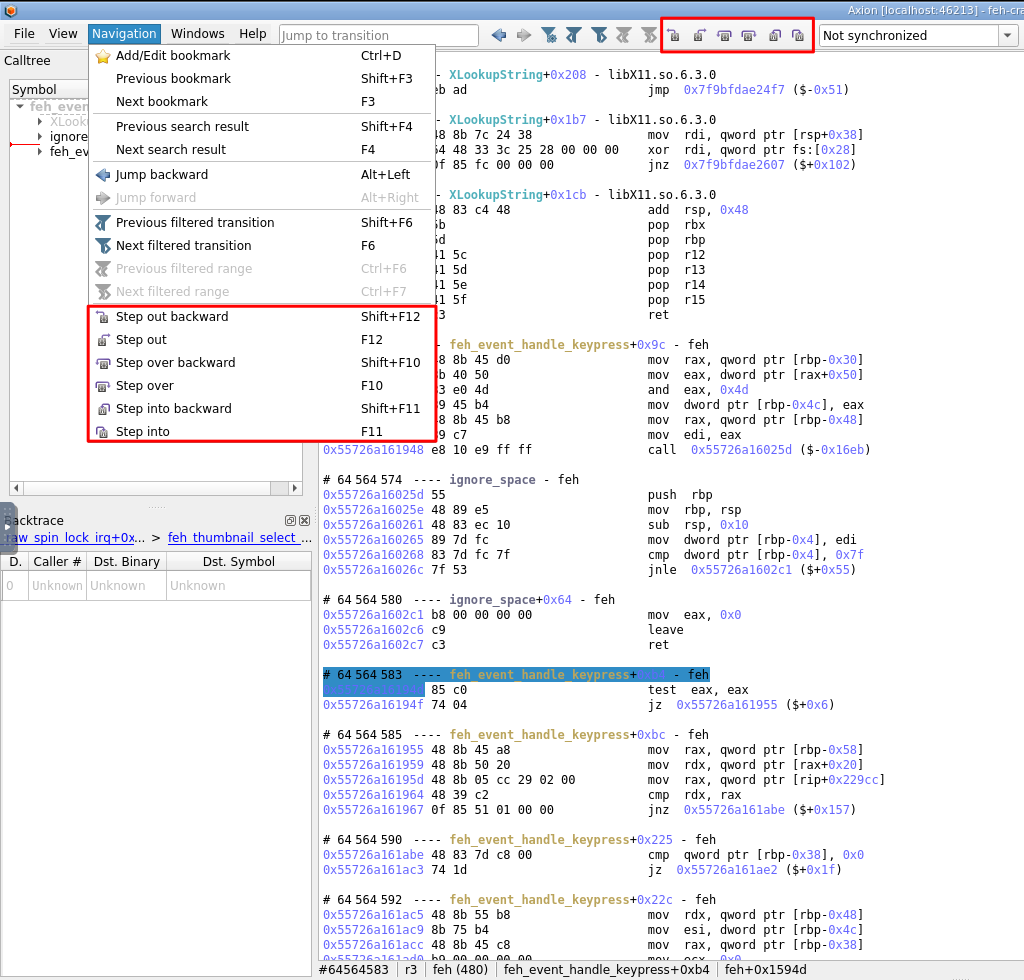
| Action | Default shortcut |
|---|---|
| step over | F10 |
| step over backward | Shift + F10 |
| step into | F11 |
| step into backward | Shift + F11 |
| step out | F12 |
| step out backward | Shift + F12 |
Step out
Use step out to exit the current function:
- step out forward to go to the instruction after the
ret. - step out backward to go the
callinstruction.
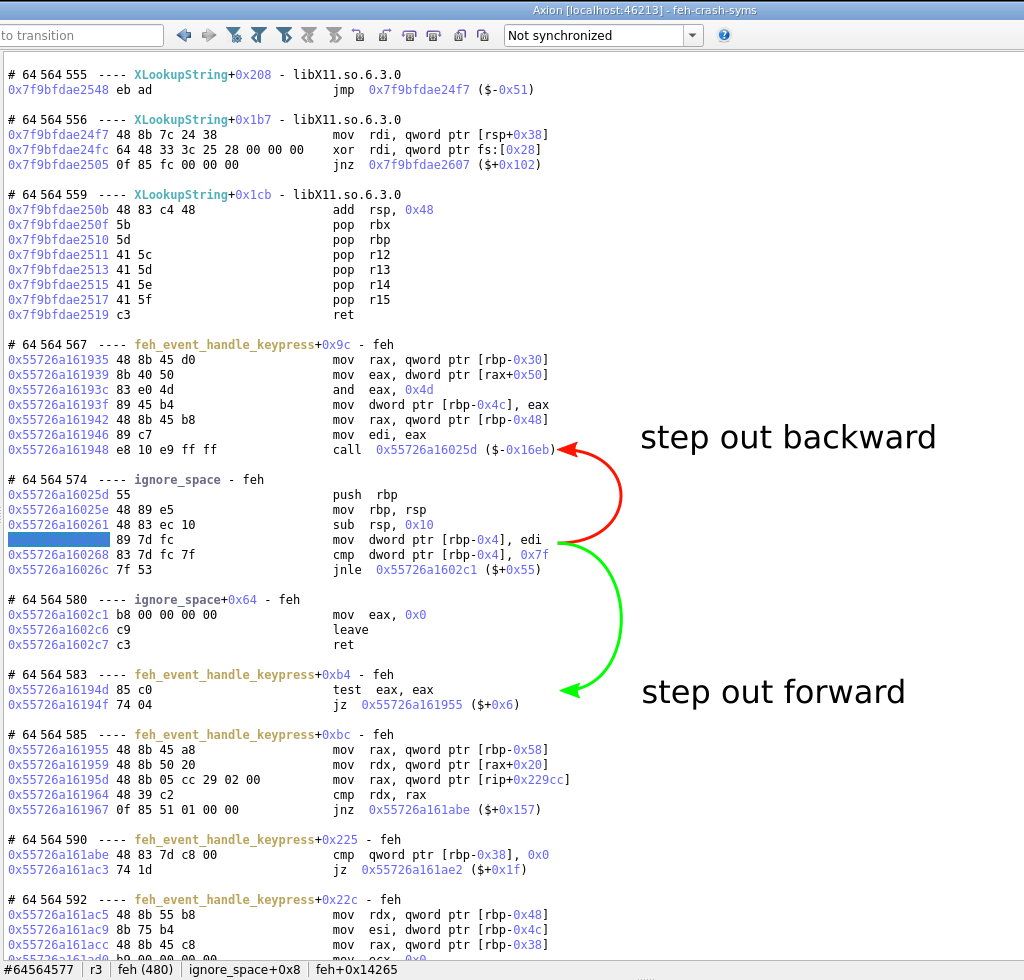
Step into and step over
Forward
On a call instruction, use:
- step into to enter the function (go to the
ret) - step over to skip the function and go to the instruction after the
ret
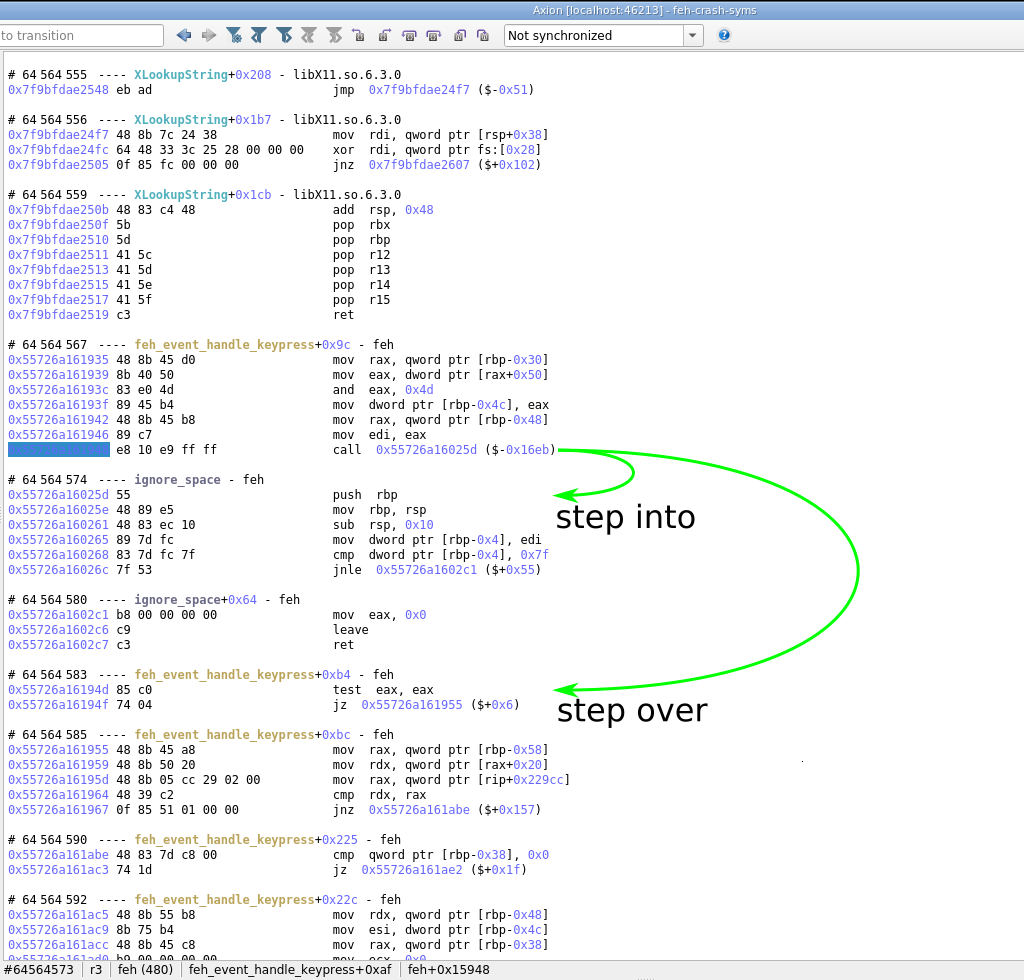
On any other instruction, step into and step over would both go to the next instruction.
Backward
After a ret instruction, use:
- step into backward to enter the function
- step over backward to skip the function and go to the
callinstruction.
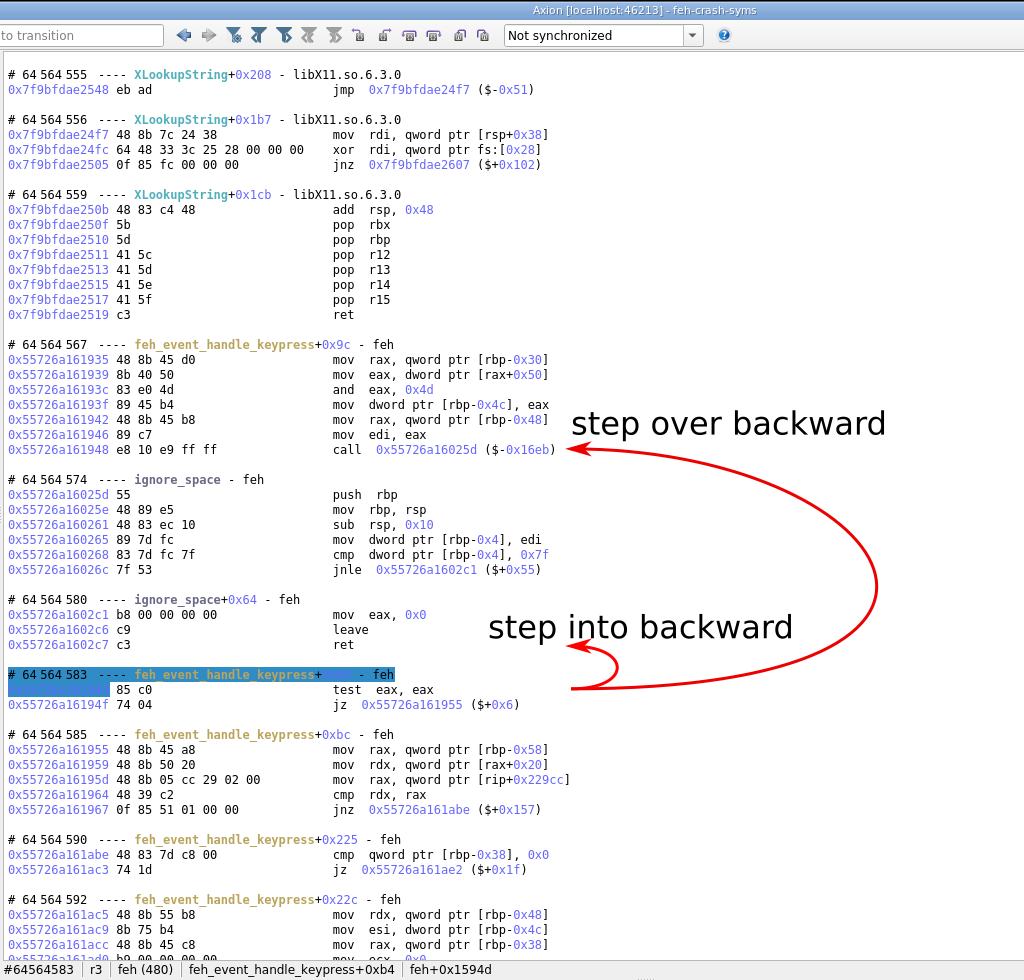
On any other instruction, step into backward and step over backward would both go to the previous instruction.
Reaching the ends of the trace
If the destination of a debugging command was not recorded in the trace (comes from before or after the trace), the step action has no effect and a message is displayed in the status bar and logged in the log widget
Axion percent plugin
The percent plugin adds the capability of jumping between stack memory
accesses. If the currently selected instruction writes something on the stack,
percent will go to the next instruction reading the memory. Conversely, if the
current instruction is reading some value on the stack, percent will jump to
the previous instruction writing the memory. In practice, this is very useful
to follow push/pop operands or call/ret boundaries.
The plugin is named percent as it has been designed to work like the vim editor
percent keybinding on curly brackets.
The default key binding for this plugin is %. If you wish to modify this
binding, use the shortcut configuration panel in Axion
Axion Synchronization
The synchronization feature allows to instruct Axion to select a transition or an address from a Python client connected to the same server.
To do so, you can setup Axion to listen to events sent to a named "session".
Basic setup
The session currently listened to is indicated by the dropdown list on the right of the status menu.
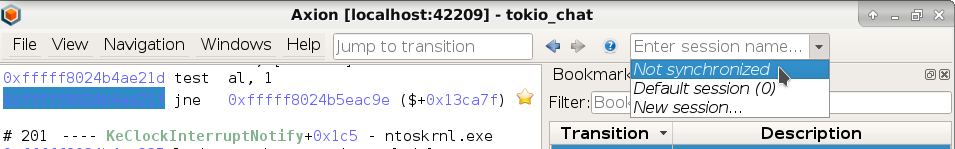
By default, the synchronization is disabled for Axion clients (the "Not synchronized" item is selected).
To enable synchronization, use the session dropdown list to select the Default Session
From there, you can select a transition in Axion from a Python client connected to the same server and the same session:
server.sessions.publish_transition(server.trace.transition(4242)) # Select transition #4242
Please refer to the Python API guide for more information about how to connect to a REVEN server using Python.
Advanced setup
If you want several Axion clients to listen to different Python clients, you can use the session dropdown list and select the "New Session..." item to input a new session name.

This will create a new session on the REVEN server.
From there, you can set up Python to send events to that session, and only Axion clients listening to that session will received them:
# Only the axion client listening to "MySession" will receive events
server.sessions.tracked = "MySession"
server.sessions.publish_transition(server.trace.transition(1212))
Note that we did not need to set the tracked session in the basic setup section, because
the default session is tracked by default.
For more information about sessions handling in the Python API, please refer to the documentation of the Sessions class.
Axion ret-sync Plugin
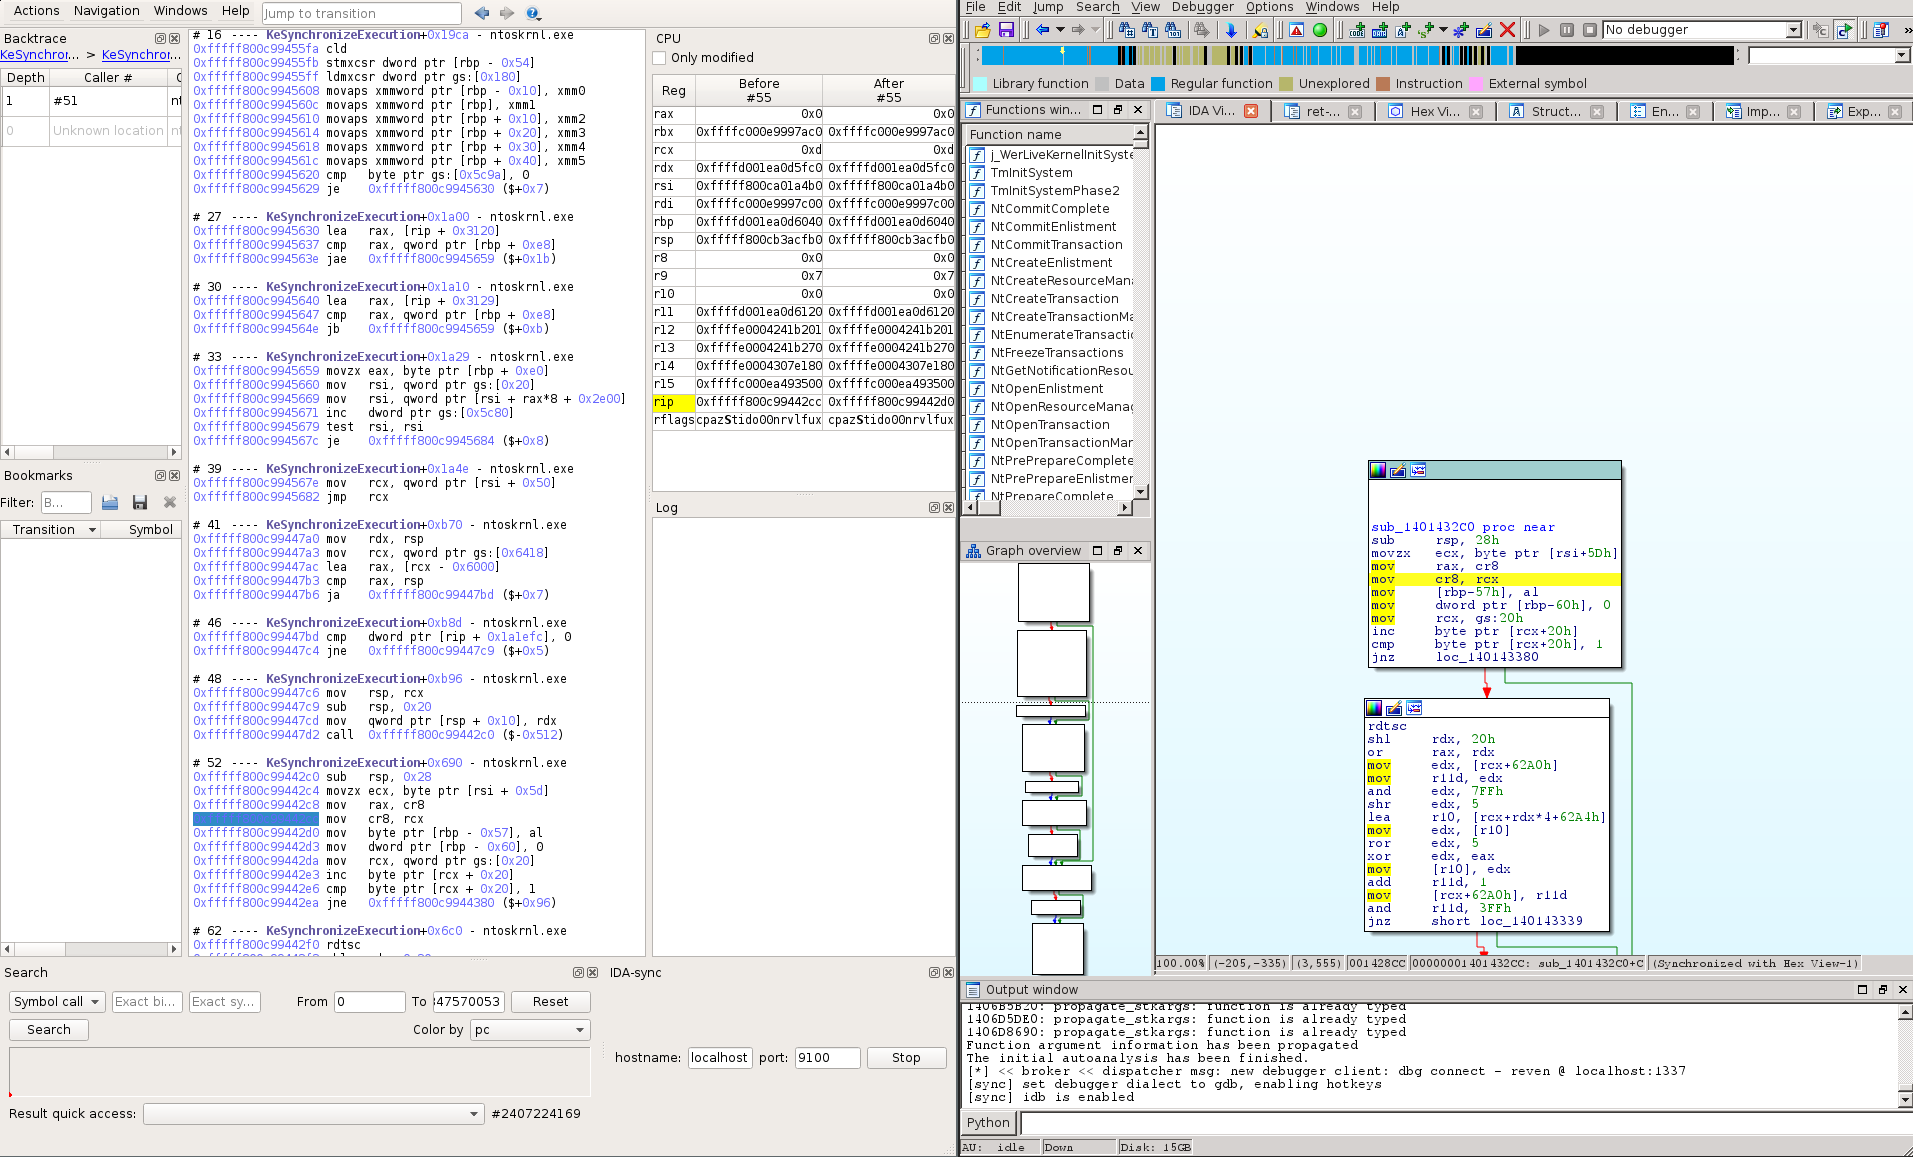
The Axion ret-sync plugin enables the synchronization of IDA/Ghidra instances with the
currently selected instruction of an Axion instance. It is basically a wrapper
around ret-sync, which is a tool written by Alexandre Gazet.
Setting up the plugin
Prerequisites
In order to use the synchronization working, you must:
- have the OSSI for your scenario activated on the REVEN server.
- ensure network connectivity between the Axion and IDA/Ghidra hosts. In particular, if a firewall is activated, it must allow to open a socket on the selected host and port.
Download the ret-sync tool
To use the plugin, you have to download ret-sync from Github and go to the latest known working git commit.
git clone https://github.com/bootleg/ret-sync
cd ret-sync
git checkout 98698a5705dac4e5ffe834002017a7a339eeb2bc
Configuring the ret-sync tool
ret-sync allows remote setup, that is having IDA/Ghidra on a different host than Axion. To allow this kind of configuration, the ret-sync IDA/Ghidra plugins handles debugger events through a network socket and dispatches them to the right IDA/Ghidra window. More information can be found the Github repository.
The figure below describes how ret-sync is deployed between Axion and IDA/Ghidra.
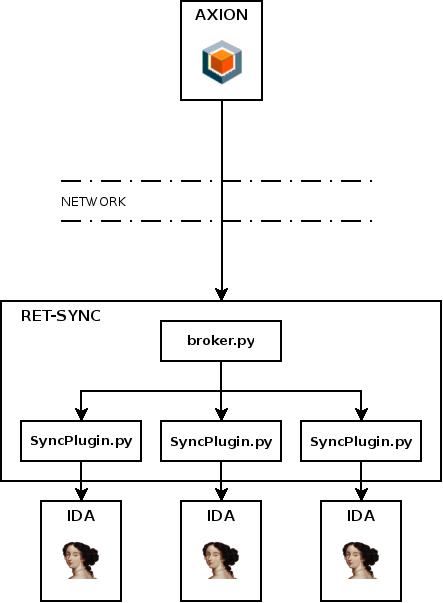
By default, ret-sync will work on a local configuration where IDA/Ghidra and Axion are on the same host (ret-sync will listen on 127.0.0.1). If it is your case you can skip this part.
To allow remote usage of ret-sync, a configuration file must be placed on the
IDA/Ghidra host. The configuration file should be named exactly .sync and can be
located either in the IDB or in the Home directories. The .sync file follows
the .ini syntax and allows setting the host and port the ret-sync will listen
on. eg:
[INTERFACE]
host=192.168.1.16
port=9100
The host option is the IDA/Ghidra host machine address, which can be retrieved by
issuing an ipconfig command on Windows or ifconfig / ip addr on Linux.
Install the ret-sync IDA plugin
IDA7.x
Copy Syncplugin.py and retsync folder from
ret-sync/ext_ida to IDA plugins directory, for example:
C:\Program Files\IDA Pro 7.4\plugins%APPDATA%\Hex-Rays\IDA Pro\plugins~/.idapro/plugins
IDA6.9x
- Go to the
ida6.9xgit tag:
cd <ret-sync dir>
git fetch
git checkout ida6.9x
- Follow the installation step from the README file
Install the ret-sync Ghidra plugin
-
From Ghidra projects manager:
File->Install Extensions..., click on the+sign and select theext_ghidra/dist/ghidra_*_retsync.zipand click OK. This will effectively extract theretsyncfolder from the zip into$GHIDRA_DIR/Extensions/Ghidra/ -
Restart Ghidra as requested
-
After reloading Ghidra, open a module in CodeBrowser. It should tell you a new extension plugin has been detected. Select "yes" to configure it. Then tick "RetSyncPlugin" and click OK. The console should show something like:
[*] retsync init
[>] programOpened: tm.sys
    imageBase: 0x1c0000000
The latest known working version of Ghidra for synchronization with Axion is 9.2.2.
Enable the synchronization
Loading target binary in IDA/Ghidra
To synchronize an IDA/Ghidra instance with Axion, you obviously need to load a binary used in the scenario. If you do not already have this binary, you can extract it from the light filesystem of your scenario, in:
SCENARIO_REPLAY_DIRECTORY/light_fs/
If the binary was uploaded to the VM via the CD-Rom, you can also search for it in:
SCENARIO_INPUT_DIRECTORY/
Where SCENARIO_REPLAY_DIRECTORY and SCENARIO_INPUT_DIRECTORY are
respectively the "Replay" and "Input" directories of your scenario, as indicated
in the "Scenario details" page of your scenario in the Project Manager.
Running the ret-sync IDA/Ghidra plugin
IDA7.x
Start the plugin in IDA using the shortcut Alt+Shift+S or via the menu Edit -> Plugins -> ret-sync.
IDA6.9x
Load the file <ret-sync dir>/ext_ida/SyncPlugin.py using the File > Script File menu.
This will create a ret-sync process listening for debugger events.
Once loaded, the plugin will create a new tab in IDA and allow you to change the binary name. IDA-Sync enables the synchronization only when the correct binary is being debugged so you must ensure that the IDA and REVEN binary names are perfectly matching.
Ghidra
Enable the plugin in the Ghidra codebrowser using shortcuts Alt+S.
Running the Axion ret-sync plugin
- Open the Axion ret-sync plugin from the Axion menu
View > ret-sync. - Fill the host and port fields using the machine address and port of the machine where IDA/Ghidra is running on.
NOTE: If the base address of the studied binary is different between Axion and IDA/Ghidra (because of ASLR for example), the synchronisation will still work correctly but the displayed addresses will not match between Axion and IDA/Ghidra. To have the same addresses, the binary in must be rebased to the base address used in Axion. To do that you can use in
- IDA: the menu
Edit > Segments > Rebase Program. - Ghidra: the menu
Window > Memory Mapthen click on the top right house button.
Then you must restart the plugins in IDA/Ghidra and Axion.
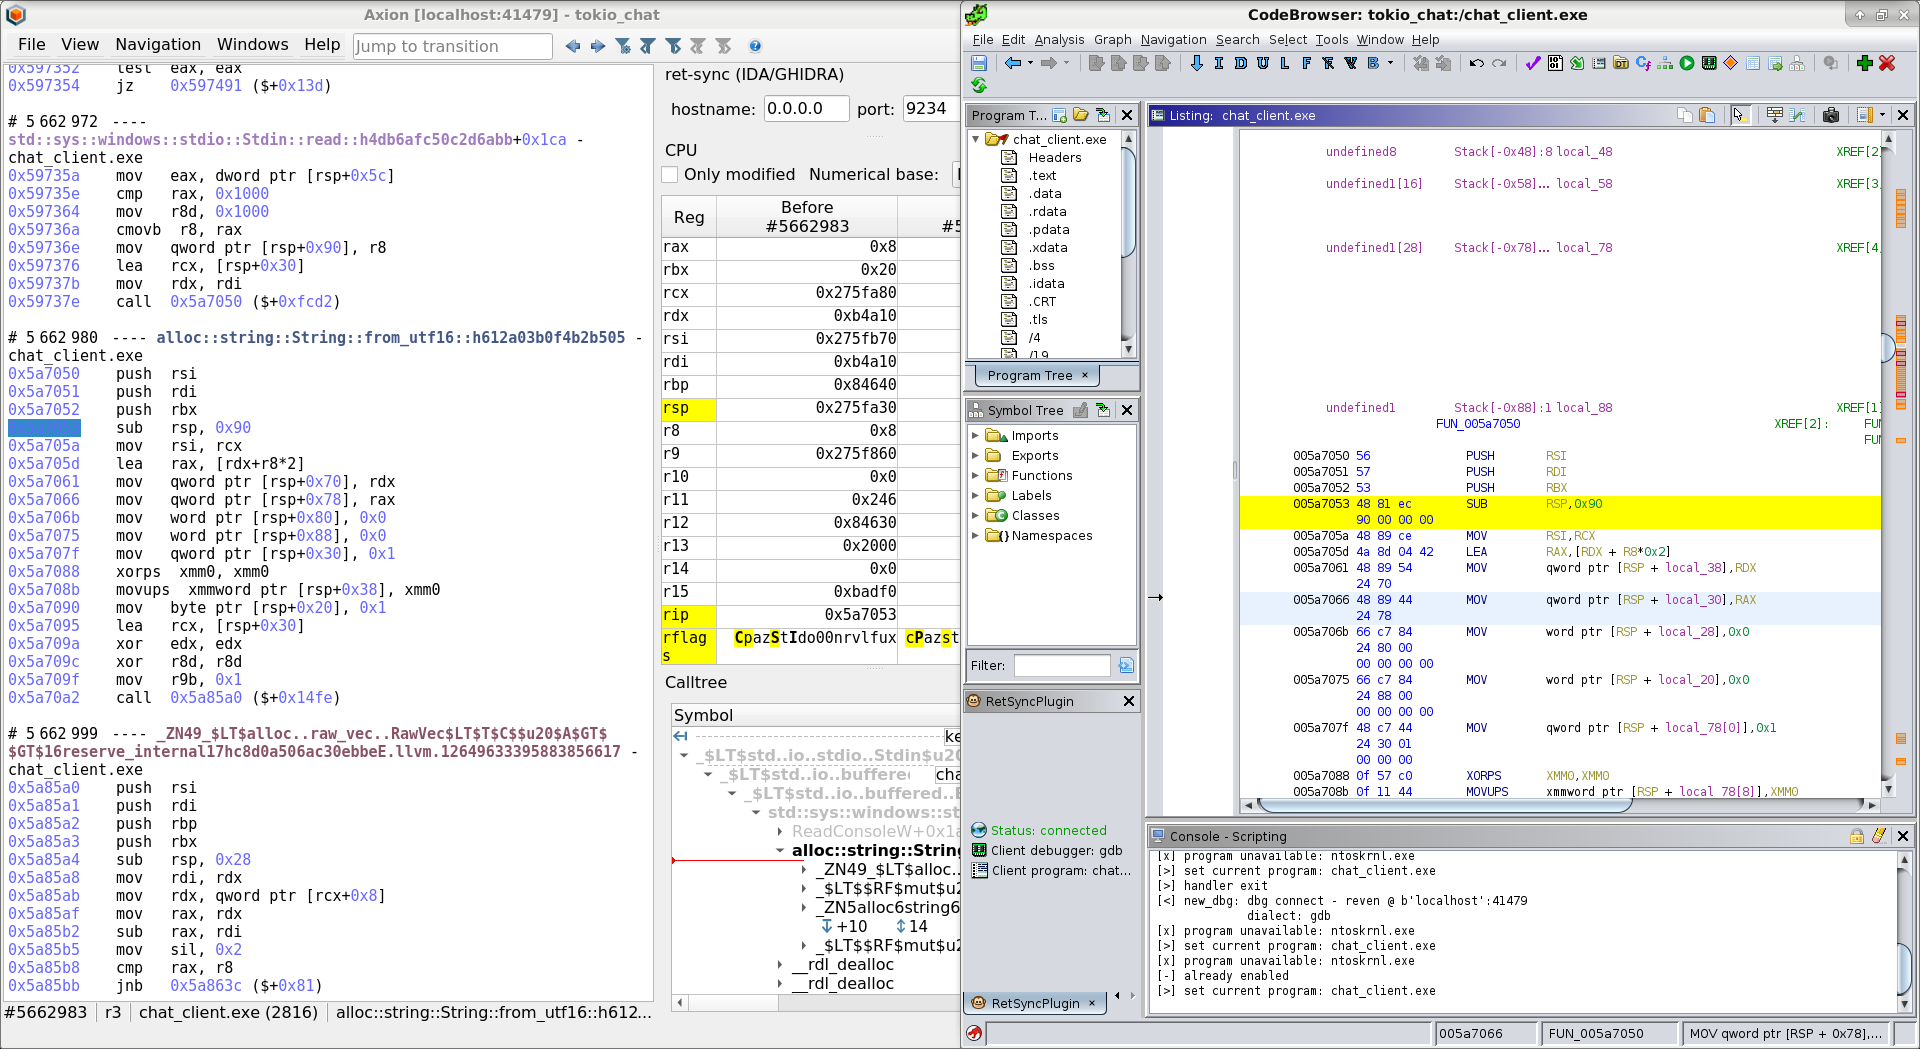
REVEN Python API
With the REVEN Python API, reverse engineers can automate the analysis of a scenario by scripting.
Python API reference
REVEN Python API installation guide
Pre-requisites
The supported platforms for installing the REVEN Python API are Debian 10 Buster 64 bits and Windows 10 64 bits. A working 3.7 (CPython) installation is also required.
Note for Debian: other dependencies will be installed over the course of this document and can be found in the
dependencies.sh file.
Since Python 2 reached its end-of-life in January 2020, we only provide a Python 3 version of the API.
Via Jupyter Notebook
REVEN provides integration with Jupyter Notebook, which allows you to use the REVEN Python API from your browser. For more information on this method of using the API, please refer to the dedicated documentation page.
On the REVEN server
If your Python development environment is on the same machine as your REVEN server, then the Python API is already
installed, and you just need to activate it.
Go to the install path of your REVEN package, then execute the following in a bash shell:
source sourceme_python3
This results in activating a virtualenv with the Python API installed. To
deactivate it and get back to your original Python environment, either open a new shell, or run the deactivate
command in the current shell where the virtualenv was activated.
Note that the sourceme_python3 file is a bash script and may not work as intended when
sourced from different shells (fish, zsh...).
On a client workstation
To install on a client workstation, you will need to download the corresponding archive from the Download
page of the Project Manager.
Choose the package corresponding to the desired OS and Python version.
This section assumes that you are working from the root directory of the decompressed archive.
Main installation options
Python development provides many ways of installing a Python package. This document covers the main installation options.
-
Using a virtualenv: A local installation that won't conflict with any other Python environment in your system. This is the most recommended way to make Python development, since it will guarantee that you won't break any existing Python script by accidentally upgrading a common dependency.
On Debian 10 Buster, we provide asourcemebash script that automatically creates a virtualenv containing the REVEN Python API for you. For a virtualenv installation under Windows, you will first need to activate a virtualenv and then usepipnormally during the next section. -
A user-wide installation: This installation does not conflict with other users on the system, but you may have to manually setup the environment for your Python packages to be found.
For a user-wide installation, you'll need to usepipwith a--useroption after theinstallargument during the next section. -
A system-wide installation: This installation may conflict with other users or applications on the system, and requires root privileges. But after a system-wide installation, any user on the system will be able to use the REVEN Python API.
For a system-wide installation, you will need to usepipwithrootprivilege on Debian Buster (sudofor example), and normally on Windows during the next section.
Windows
First, be sure to have a 64-bit 3.7 installation available with the pip utility installed. The default Python
installer typically provides this component.
NOTE: the REVEN python API is not compatible with a 32-bit python environment.
- Step 1 (optional): create the virtualenv
The following Powershell lines will provide you with a virtualenv namedenvin your current working directory.
python.exe -m pip install virtualenv  # Not required if you already have virtualenv installed
python.exe -m virtualenv --system-site-packages env
env\Scripts\activate
- Step 2 (required): upgrade the
piputility:
python.exe -m pip install --upgrade pip
- Step 3 (required): install the REVEN API
Paths are given relative to this current folder.
python.exe -m pip install (Get-Item dependencies\*.whl).FullName
python.exe -m pip install (Get-Item reven_api*.whl).FullName
python.exe -m pip install (Get-Item reven2*.whl).FullName
Debian 10 Buster
For a Debian 10 Buster client, the recommended way to use the Python API is to simply source the sourceme file
contained in the downloaded archive:
- Step 1 (required): install the system dependencies
Paths are given relative to this current folder.
sudo ./dependencies.sh
- Step 2: source the
sourcemefile
source sourceme
This will leave in a virtual environment where reven2 can be imported:
python -c "import reven2"
Note that the sourceme file is a bash script and may not work as intended when
sourced from different shells (fish, zsh...).
Debian 10 Buster, manual installation
If you prefer installing in your own virtualenv, or as user or system-wide, follow the instructions below.
First, be sure to have a Python installation available with the corresponding pip utility installed.
- Step 1 (required): install the system dependencies Paths are given relative to this current folder.
sudo ./dependencies.sh
- Step 2 (optional): create the virtualenv
sudo apt install python3-venv  # If venv is not already installed
python3 -m venv --system-site-packages env
source env/bin/activate
- Step 3 (required): upgrade the
piputility
python -m pip install --upgrade pip
- Step 4 (required): install the REVEN API
Paths are given relative to this current folder.
python -m pip install dependencies/*.whl
python -m pip install reven_api*.whl
python -m pip install reven2*.whl
Next steps
If you successfully completed the previous steps, you should have a working REVEN Python API. Feel free to check out the Quick start guide for a smooth kick-off.
REVEN Python API quick start
With the REVEN Python API, reverse engineers can automate the analysis of a scenario by scripting.
Python API reference documentation
- About this document
- Installation
- Basic usage
- Main concepts
- Feature overview
- Going further
About this document
This document is a quick start guide to the REVEN Python API. The REVEN Python API can be used to automate several aspects of REVEN:
- The recording/replay workflow (Workflow Python API), only available in the Enterprise Edition.
- The analysis of an already replayed scenario (Analysis Python API).
This document focuses solely on the Analysis Python API. It covers the following topics:
- Installation
- Basic usage
- Main concepts
- Overview of the available features
Along the way, this document provides some simple recipes you can use to automate various tasks.
You can follow along the code examples of this document by downloading from our website the CVE-2020-15999 (Windows 7) scenario and then importing it into REVEN. You might need a dozen of minutes and 11GB of disk space for replaying this scenario.
Installation
Please refer to the Installation page for more information on installing the Python API.
You can also use the Jupyter notebook integration to use the API.
Basic usage
Once you've installed the Python API (see the Installation document), you're ready for your first script.
Import the reven2 package:
>>> # Importing the API package
>>> import reven2
Connecting to a server
To use the Python API, you have to connect to a REVEN server started on the scenario you want to analyze. To do this, you must provide the host and port of your REVEN server:
>>> # Connecting to a reven server
>>> hostname = "localhost"
>>> port = 13370
>>> server = reven2.RevenServer(hostname, port)
>>> server
Reven server on CVE-2020-15999-Windows7 (localhost:13370) [connected]
If you are using the Python API from the same machine than the REVEN server itself, then the host is "localhost",
otherwise it is the address of your server.
To find the port, you can go to the Analyze page for the scenario you want to connect with, and the port number will be
displayed in the label above the buttons (REVEN running on port xxxx):
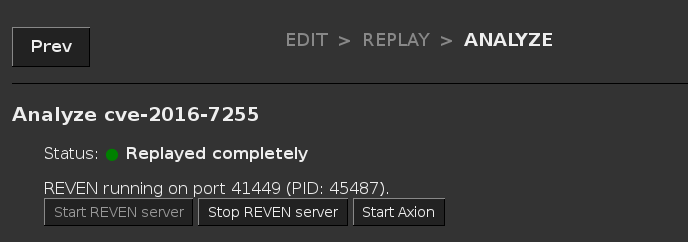
Alternatively, you can find the port in the Active sessions list:
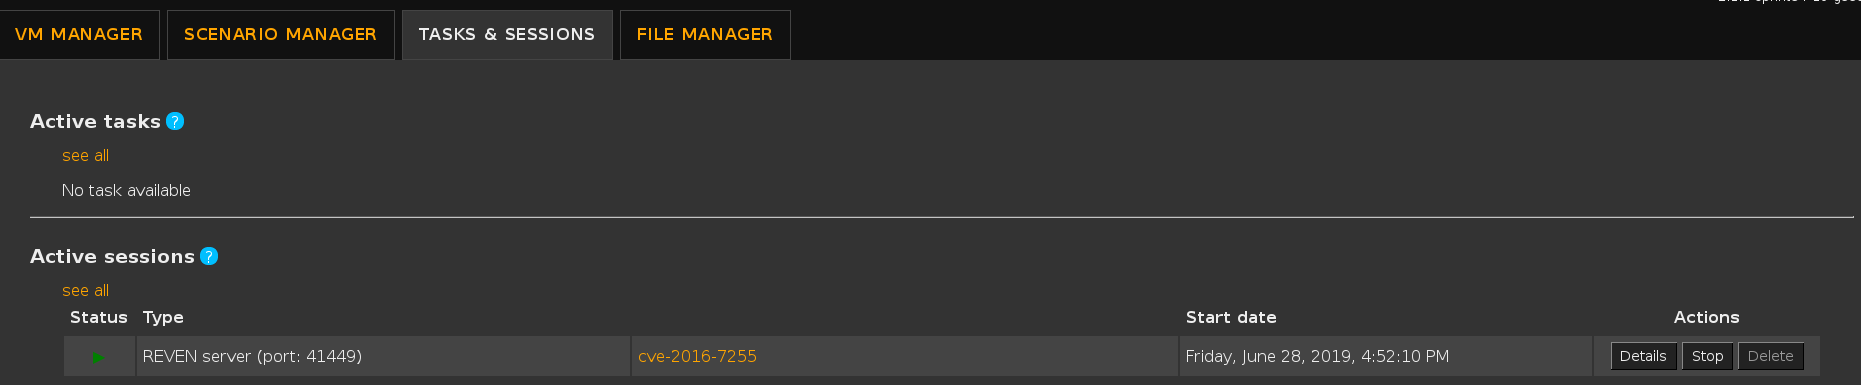
Finally, if you have an Axion client connected to your REVEN server, you can find the port in the titlebar of the Axion window:

Connecting to a server from the scenario's name
NOTE: This section only applies to REVEN enterprise edition.
You can use a feature of the Workflow API to get a connection to a server from the scenario's name, rather than by specifying a port:
>>> from reven2.preview.project_manager import ProjectManager
>>> pm = ProjectManager("http://localhost:8880")  # URL to the REVEN Project Manager
>>> connection = pm.connect("CVE-2020-15999-Windows7")  # No need to specify "13370"
>>> server = connection.server
>>> server
Reven server on CVE-2020-15999-Windows7 (localhost:13370) [connected]
This is useful, as the server port will typically change at each reopening of the scenario, while the scenario name remains the same.
If no server is open for that particular scenario when executing the ProjectManager.connect method call, then a new one will be started.
Root object of the API, tree of objects
The RevenServer instance serves as the root object of the API from where you can access all the features of the API.
The following diagram gives a high-level view of the Python API:
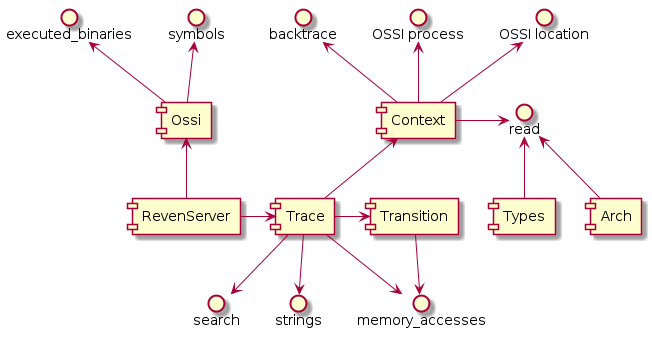
For instance, from there you can get the execution trace and ask for the total number of transitions in the trace:
>>> # Getting the trace object
>>> trace = server.trace
>>> # Getting the number of transitions in the trace
>>> trace.transition_count
158693449
In your Python interactive shell, you can also use the help built-in function to directly access the documentation while coding (see the official Python documentation for more details on this function).
We recommend using a feature-rich shell like ipython or bpython to benefit from e.g. auto-completion while using the Python API.
Main concepts
Getting a point in time
As is visible in Axion, all instructions are identified by a single unique integer, called the transition id. The transition id starts at 0 for the first instruction in the trace, and is incremented by 1 for each consecutive instruction.
NOTE: We are using the term Transition rather than Instruction here, because technically, not all Transitions in
the trace are Instructions: when an interrupt or a fault occurs, it is also denoted by a Transition that changed the
Context, although no Instruction was executed. Similarly, instructions that execute only partially (due to being
interrupted by e.g. a pagefault) are not considered as normal Instructions. You can see a Transition as a
generalized Instruction, i.e. something that modifies the context.
Getting a transition
You can get interesting transition numbers from Axion's Trace view.
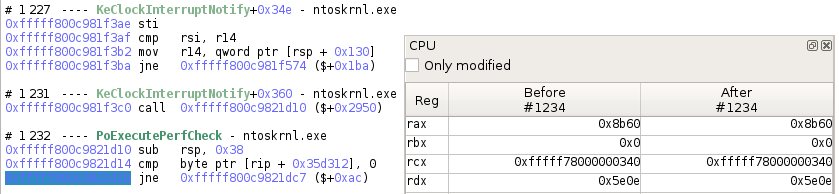
>>> # Getting a transition
>>> transition = trace.transition(1234)
>>> # Displays the transition as seen in Axion
>>> print(transition)
#1234 lock and qword ptr ds:[rdi+0x40], 0x0
>>> # Is this transition an instruction?
>>> transition.instruction is not None
True
Getting a context
A Transition is representing a change in the trace, while Contexts represent a state in the trace.
From a transition, you can get either the context before the transition was applied, or the context after the transition was applied:
>>> # Comparing rip before and after executing an instruction
>>> ctx_before = transition.context_before()
>>> ctx_after = transition.context_after()
>>> "0x{:x}".format(ctx_before.read(reven2.arch.x64.rip))
'0xfffff800028cc175'
>>> "0x{:x}".format(ctx_after.read(reven2.arch.x64.rip))
'0xfffff800028cc17b'

>>> # Directly getting a context from the trace object
>>> trace.context_before(0x1234) == trace.transition(0x1234).context_before()
True

>>> # Getting a transition back from a context
>>> transition.context_before().transition_after() == transition
True
Reading a context
A common operation on a Context instance is to read the state of the CPU registers as well as memory.
The API provides the read method on Context, that allows to read from a source.
Getting a register or an address
To read from a register source, you can reference elements exposed by the arch package:
>>> import reven2.arch.x64 as regs
>>> ctx = transition.context_before()
>>> ctx.read(regs.rbx)
18446738026434307840
>>> ctx.read(regs.bl)
0
>>> # Are we in kernel land?
>>> ctx.read(regs.cs) & 3 == 0
True
To read from a source address, use the address module to construct addresses:
>>> # Comparing the bytes at RIP in memory with the bytes of the instruction
>>> from reven2.address import LogicalAddress, LinearAddress, PhysicalAddress
>>> rip = ctx.read(regs.rip)
>>> instruction = transition.instruction
>>> ctx.read(LogicalAddress(rip, regs.cs), instruction.size) == instruction.raw
True
Reading as a type
The types package of the API provides classes and instance dedicated to the representation of data types.
They allow to read a register or some memory as a specific data type.
>>> from reven2 import types
>>> # Reading rax as various integer types
>>> ctx.read(regs.rbx, types.U8)
0
>>> ctx.read(regs.rbx, types.U16)
42752
>>> ctx.read(regs.rbx, types.I16)
-22784
>>> # Reading in a different endianness (default is little endian)
>>> ctx.read(regs.rbx, types.BigEndian(types.U16))
167
>>> # Reading some memory as a String
>>> ctx.read(LinearAddress(0x7fef2b09298), types.CString(encoding=types.Encoding.Utf8, max_character_count=1000))
'../../services/network/network_service.cc'
>>> # Reading the same memory as a small array of bytes
>>> list(ctx.read(LinearAddress(0x7fef2b09298), types.Array(types.U8, 4)))
[46, 46, 47, 46]
>>> # Dereferencing rsp + 0x20 in two steps
>>> addr = LogicalAddress(0x20) + ctx.read(regs.rsp, types.USize)
>>> ctx.read(addr, types.U64)
0
>>> # Dereferencing rsp + 0x20 in one step
>>> ctx.deref(regs.rsp, types.Pointer(types.U64, base_address=LogicalAddress(0x20)))
0
Identifying points of interest
One of the first tasks you need to perform during an analysis is finding an interesting point from where to start the analysis. The API provides some tools designed to identify these points of interests.
Getting and using symbol information
A typical starting point for an analysis is to search points where a specific symbol is executed. In the API, this is done in two steps:
- Identify the symbol in the available symbols of the trace.
- Search for the identified symbol.
For the first step, you need to recover the OS Semantics Information (OSSI) instance tied to your RevenServer instance:
>>> # Recovering the OSSI object
>>> ossi = server.ossi
Note that for the OSSI feature to work in the API, the necessary OSSI resources must have been generated. Failure to do so may result in several of the called methods to fail with an exception. Please refer to the documentation of each method for more information.
From there you can use the methods of the Ossi instance to get the binaries that were executed in the trace, and all
the symbols of these binaries.
Note that each of these methods, like all methods returning several results of the API, return Python generator objects.
>>> # Getting the first binary named "ntoskrnl.exe" in the list of executed binaries in the trace
>>> ntoskrnl = next(ossi.executed_binaries("ntoskrnl.exe"))
>>> ntoskrnl
Binary(path='c:/windows/system32/ntoskrnl.exe')
>>> # Getting the list of the symbols in "ntoskrnl.exe" containing "NtCreateFile"
>>> nt_create_files = list(ntoskrnl.symbols("NtCreateFile"))
>>> nt_create_files
[FunctionSymbol(binary='ntoskrnl', name='NtCreateFile', rva=0x37fcbc), FunctionSymbol(binary='ntoskrnl', name='VerifierNtCreateFile', rva=0x521b70)]
Once you have a symbol or a binary, you can use the search feature to look for contexts whose rip location
matches the symbol or binary.
>>> # Getting the first context inside of the first call to `NtCreateFile` in the trace
>>> create_file_ctx = next(trace.search.symbol(nt_create_files[0]))
>>> create_file_ctx
Context(id=106965747)
>>> # Getting the first context executing the `chrome.exe` binary
>>> chrome = next(ossi.executed_binaries("chrome.exe"))
>>> chrome_ctx = next(trace.search.binary(chrome))
>>> chrome_ctx
Context(id=2291077)
For any context, you can request the current OSSI location and process:
>>> # Checking that the current symbol is NtCreateFile
>>> create_file_ctx.ossi.location()
Location(binary='ntoskrnl', symbol='NtCreateFile', address=0xfffff80002bd4cbc, base_address=0xfffff80002855000, rva=0x37fcbc)
>>> # Getting the current process
>>> create_file_ctx.ossi.process()
Process(name='chrome.exe', pid=1784, ppid=924, asid=0x11b75000)
>>> # When the symbol is unknown it is not displayed and set to None.
>>> # This doesn't happen in the sample scenario though.
>>> # trace.context_before(unknown_symbol).ossi.location()
>>> # trace.context_before(unknown_symbol).ossi.location().symbol is None

>>> # When the whole location is unknown it is set to None
>>> trace.context_before(171814).ossi.location() is None
True
You can also request the location corresponding to a different (currently mapped) cs virtual address:
>>> # Requesting the 'NtCreateFile' symbol location from a context at a different location
>>> ctx.ossi.location()
Location(binary='ntoskrnl', symbol='KiDeferredReadyThread', address=0xfffff800028cc175, base_address=0xfffff80002855000, rva=0x77175)
>>> ctx.ossi.location(0xfffff80002bd4cbc)
Location(binary='ntoskrnl', symbol='NtCreateFile', address=0xfffff80002bd4cbc, base_address=0xfffff80002855000, rva=0x37fcbc)
>>> # Moving a bit changes the rva
>>> hex(ctx.ossi.location(0xfffff80002bd4cdf).rva)
'0x37fcdf'
Searching executed addresses in the trace
If you don't have a symbol attached to your address, you can also search for a specific address using the search function:
>>> # Searching for an executed address we saw in `chrome.exe`
>>> chrome_ctx == next(trace.search.pc(0x140009700))
True
Searching for strings in the trace
You can use the strings feature to search points in the trace where strings are first accessed or created:
>>> # Looking for a string containing "Network"
>>> string = next(trace.strings("Network"))
>>> string
String(data='../../services/network/network_service.cc\\0', size=42, address=LinearAddress(offset=0x7fef2b09298), first_access=#230200 movzx r9d, byte ptr ds:[rdx+rax*1], last_access=Transition(id=136646061), encoding=<Encoding.Utf8: 0>)
>>> # Getting the first 4 memory accesses for the string
>>> import itertools
>>> for access in itertools.islice(string.memory_accesses(), 4):
...     print(access)
...
[#230200 movzx r9d, byte ptr ds:[rdx+rax*1]]Read access at @phy:0x39206298 (virtual address: lin:0x7fef2b09298) of size 1
[#230207 movzx r9d, byte ptr ds:[rdx+rax*1]]Read access at @phy:0x39206299 (virtual address: lin:0x7fef2b09299) of size 1
[#230214 movzx r9d, byte ptr ds:[rdx+rax*1]]Read access at @phy:0x3920629a (virtual address: lin:0x7fef2b0929a) of size 1
[#230221 movzx r9d, byte ptr ds:[rdx+rax*1]]Read access at @phy:0x3920629b (virtual address: lin:0x7fef2b0929b) of size 1
Manually iterating in the trace
Another way of searching interesting points is by iterating over contexts or transitions, and then looking for various information by inspecting the context or transition. Beware that if you iterate on a large portion of the trace, it may take a very long time to complete, so prefer the predefined search APIs that use optimized indexes whenever it is possible.
>>> # Finding first instruction whose mnemonic is swapgs
>>> # Warning: this example may take some time to execute
>>> def find_mnemonic(trace, mnemonic, from_transition=None, to_transition=None):
...     for i in range(from_transition.id if from_transition is not None else 0,
...                    to_transition.id if to_transition is not None else trace.transition_count):
...         t = trace.transition(i)
...         if t.instruction is not None and mnemonic in t.instruction.mnemonic:
...             yield t
...
>>> next(find_mnemonic(trace, "swapgs"))
Transition(id=20)
Combining the predefined search APIs with manual iteration allows to iterate over a smaller portion of the trace to extract useful information:
>>> # Finding all files that are created in a call to NtCreateFile
>>> def read_filename(ctx) -> str:
...     # The third argument to the call is an _OBJECT_ATTRIBUTES structure, the filename is stored in:
...     # _OBJECT_ATTRIBUTES->ObjectName.Buffer
...     ty : types.Struct = ntoskrnl.exact_type("_OBJECT_ATTRIBUTES")
...     object_attribute: StructInstance = ctx.deref(regs.r8, types.Pointer(ty))
...     unicode_string = object_attribute.field("ObjectName").deref_struct()
...     return unicode_string.field("Buffer").deref_str(
...         types.CString(encoding=types.Encoding.Utf16, max_size=unicode_string.field("Length").read_int())
...     )
...
>>> for (index, ctx) in enumerate(trace.search.symbol(nt_create_files[0])):
...     if index > 5:
...         break
...     print("{}: {}".format(ctx, read_filename(ctx)))
...
Context before #106965747: \Device\Afd\Endpoint
Context before #132588377: \??\C:\Users\IEUser\AppData\Local\Google\Chrome\User Data\Default\Cache\f_000005
Context before #137264445: \??\C:\Users\IEUser\AppData\Local\Google\Chrome\User Data\Default\Cache\f_000005
Context before #137309118: \??\C:\Users\IEUser\AppData\Local\Google\Chrome\User Data\Default\Cache\f_000005
Moving in the trace
Once you identified point(s) of interest, the next step in the analysis is to navigate by following data from these points.
The API provides several features that can be used to do so.
Using the memory history
The main way to use the memory history in the trace is to use the Trace.memory_accesses method.
This method allows to look for the next access to some memory range, starting from a transition and in a given
direction:
>>> # Getting the next access to any memory range from the current point
>>> memhist_transition = trace.transition(40818)
>>> access = next(trace.memory_accesses(from_transition=memhist_transition))
>>> access
MemoryAccess(transition=Transition(id=40820), physical_address=PhysicalAddress(offset=0x122c1270), size=4, operation=MemoryAccessOperation.Read, virtual_address=LinearAddress(offset=0xb31270))
>>> # Choosing a memory range to track
>>> memory_range = access.virtual_range
>>> memory_range
MemoryRange(address=LinearAddress(offset=0xb31270), size=4)
>>> # Getting the next access to that memory range from the current point
>>> next(trace.memory_accesses(address_range=memory_range, from_transition=memhist_transition))
MemoryAccess(transition=Transition(id=40820), physical_address=PhysicalAddress(offset=0x122c1270), size=4, operation=MemoryAccessOperation.Read, virtual_address=LinearAddress(offset=0xb31270))
>>> # Getting the previous access to that memory range from the current point
>>> next(trace.memory_accesses(address_range=memory_range, from_transition=memhist_transition, is_forward=False))
MemoryAccess(transition=Transition(id=39956), physical_address=PhysicalAddress(offset=0x122c1270), size=4, operation=MemoryAccessOperation.Read, virtual_address=LinearAddress(offset=0xb31270))
>>> # Getting all accesses to that memory range in the trace
>>>
>>> # We first need to translate the range to physical addresses because the memory range is translated at the first
>>> # context of the search, which could result in different ranges being searched if the same virtual address is
>>> # mapped to different physical pages over the course of the trace.
>>> physical_ranges = list(memory_range.translate(memhist_transition.context_before()))
>>> physical_ranges
[MemoryRange(address=PhysicalAddress(offset=0x122c1270), size=4)]
>>> for access in itertools.islice(trace.memory_accesses(address_range=physical_ranges[0]), 5):
...     print(access)
...
[#26661 cmp dword ptr ds:[r15+0x80], 0x0]Read access at @phy:0x122c1270 (virtual address: lin:0xb31270) of size 4
[#27436 cmp dword ptr ds:[r14+0x80], 0x0]Read access at @phy:0x122c1270 (virtual address: lin:0xb31270) of size 4
[#31317 cmp dword ptr ds:[r14+0x80], 0x0]Read access at @phy:0x122c1270 (virtual address: lin:0xb31270) of size 4
[#32181 cmp dword ptr ds:[rsi+0x78], 0x0]Read access at @phy:0x122c1270 (virtual address: lin:0xb31270) of size 4
[#34107 cmp dword ptr ds:[r15+0x80], 0x0]Read access at @phy:0x122c1270 (virtual address: lin:0xb31270) of size 4
Note that the memory history works with physical addresses under the hood. Although it accepts virtual addresses in input, the range of virtual addresses in translated to physical ranges before querying the memory history. As a result, the vitual address range needs to mapped at the context of the translation for the call to succeed.
A secondary method to use is the Transition.memory_accesses method that provides all the memory accesses that occurred
at a given transition.
>>> # Getting all memory that is accessed during a "rep mov" operation
>>> rep_tr = trace.transition(533320)  # found with "find_mnemonic"
>>> print(rep_tr)
#533320 rep movsq
>>> [(access.virtual_address, access.size) for access in rep_tr.memory_accesses()]
[(LinearAddress(offset=0x38f140), 8), (LinearAddress(offset=0x38ed60), 8), (LinearAddress(offset=0x38f148), 8), (LinearAddress(offset=0x38ed68), 8), (LinearAddress(offset=0x38f150), 8), (LinearAddress(offset=0x38ed70), 8), (LinearAddress(offset=0x38f158), 8), (LinearAddress(offset=0x38ed78), 8), (LinearAddress(offset=0x38f160), 8), (LinearAddress(offset=0x38ed80), 8), (LinearAddress(offset=0x38f168), 8), (LinearAddress(offset=0x38ed88), 8)]
Using debugger commands
From any transition, you can move to the beginning/end of the current function by calling the Transition.step_out
method:
>>> after_ret_tr = rep_tr.step_out()
>>> print(after_ret_tr)
#683177 mov qword ptr ss:[rsp+0x98], rax
>>> call_tr = rep_tr.step_out(is_forward=False)
>>> print(call_tr)
#533289 call 0x7feff3de970
This is useful in particular to, for instance, get to a transition where the return value of the function is available, or get to a transition where the parameters of the function are available:
>>> # Find the first parameter and the return value from any transition.
>>> #
>>> # Note: this assumes standard Windows 64-bit calling conventions, and that the there is one pointer-sized argument and
>>> # one pointer-sized return value. For more precise signature recovery, see reven2-ltrace.
>>> def print_first_parameter_and_return_value(tr: reven2.trace.Transition) -> None:
...     loc = tr.context_before().ossi.location()
...     if loc is None:
...         loc = "???"
...     first_tr = tr.step_out(is_forward=False)
...     if first_tr is None:
...         first_param = "???"
...     else:
...         first_param = hex(first_tr.context_before().read(reven2.arch.x64.rcx))
...     last_tr = tr.step_out()
...     if last_tr is None:
...         ret = "???"
...     else:
...         ret = hex(last_tr.context_before().read(reven2.arch.x64.rax))
...     print(f"{loc}: first_param={first_param}, ret={ret}")
...
>>> print_first_parameter_and_return_value(rep_tr)
rpcrt4!Invoke+0x35: first_param=0x7fefc1d18f4, ret=0x0
Similarly, the Transition.step_over method can be used to skip a function on a call or ret instruction:
>>> call_tr.step_over() == after_ret_tr
True
>>> after_ret_tr.step_over(is_forward=False) == call_tr
True
Using the backtrace
For any context, you can get the associated call stack by calling the Context.stack property:
>>> # Getting the call stack
>>> rep_ctx = rep_tr.context_before()
>>> stack = rep_ctx.stack
>>> stack
Stack(Context=533320)
>>> # Displaying a human-readable backtrace
>>> print(stack)
[0] #533289 - rpcrt4!Invoke
[1] #520148 - rpcrt4!?Ndr64StubWorker@@YAJPEAX0PEAU_RPC_MESSAGE@@PEAU_MIDL_SERVER_INFO_@@PEBQ6AJXZPEAU_MIDL_SYNTAX_INFO@@PEAK@Z
[2] #520132 - umpnpmgr!NdrServerCallAll
[3] #520125 - rpcrt4!DispatchToStubInCNoAvrf
[4] #520052 - rpcrt4!RPC_INTERFACE::DispatchToStubWorker
[5] #519947 - rpcrt4!LRPC_SCALL::DispatchRequest
[6] #518073 - rpcrt4!LRPC_SCALL::HandleRequest
[7] #517417 - rpcrt4!LRPC_SASSOCIATION::HandleRequest
[8] #517381 - rpcrt4!LRPC_ADDRESS::HandleRequest
[9] #516369 - rpcrt4!LRPC_ADDRESS::ProcessIO
[10] #516330 - rpcrt4!LrpcIoComplete
[11] #516148 - ntdll!TppAlpcpExecuteCallback
[12] ??? - ntdll!RtlpCheckHeapSignature+0x75
From there, you can use the backtrace to navigate in at least two ways:
- By going back to the caller of the current frame.
>>> # Finding back the caller transition if it exists
>>> print(next(stack.frames()).creation_transition)
#533289 call 0x7feff3de970
- By going back to the previous stack. This allows for instance to switch from kernel land to user land, or to find/skip syscalls when necessary.
>>> print(stack.prev_stack())
[0] ??? - ntoskrnl!KiSystemCall64+0x293
Feature overview
The following table offers a simple comparison between widgets and features of Axion and Python API methods:
| Widget | API |
|---|---|
| CPU | Context.read |
| Trace view | Transition, Context.ossi.location, Context.ossi.process |
| Hex dump | Context.read |
| Memory History | Trace.memory_accesses, Transition.memory_accesses |
| Search | Trace.search |
| Backtrace | Context.stack |
| String | Trace.strings |
| Taint | Available in preview: preview.taint |
| Prototypes | Available in preview: preview.prototypes |
Going further
This concludes the Python API quick start guide. For further information on the Python API, please refer to the following documents:
-
Python API analysis examples that are distributed in the
Downloadspage of the REVEN Project Manager. These scripts demonstrate the possibilities offered by the Python API through more elaborate examples. Their documentation is available here. -
IDA Python API examples that are distributed in the
Downloadspage of the REVEN Project Manager. These scripts showcase the IDA compatibility of the Python API, that is, the simple capability of using the Python API from IDA:>>> import reven2 # This works from IDA, too -
The full Python API reference documentation
Jupyter Integration
REVEN includes a Jupyter notebook server so that you can easily create notebooks on a given scenario from the Project Manager.
Jupyter notebook is a web interface that allows, among other things, to execute Python code and prepare Markdown write-ups from your browser.
Using Jupyter notebook
To start using Jupyter notebook, please follow the steps below:
-
From the
Analyzepage of any scenario, click theOpen Pythonbutton. -
In the newly opened browser tab, click the
NewbuttonNOTE: When creating a new Python notebook, always choose the current version of REVEN, e.g. for REVEN 2.5, choose
reven-2.5-python3, otherwise you will not be able toimport reven2successfully. -
Go back to your
Analyzetab and click theCopy to clipboardbutton to copy the snippet allowing you to connect to the REVEN server. -
Paste the snippet as the first cell of the notebook. Execute the snippet using for instance Shift+Enter.
Axion-Jupyter synchronization
Jupyter notebooks also benefit from the Python/Axion synchronization feature.
When using the Jupyter integration, transitions and addresses are displayed as clickable links. Clicking these links will instruct any synchronized Axion to go to that transition or open a hexdump at that address.
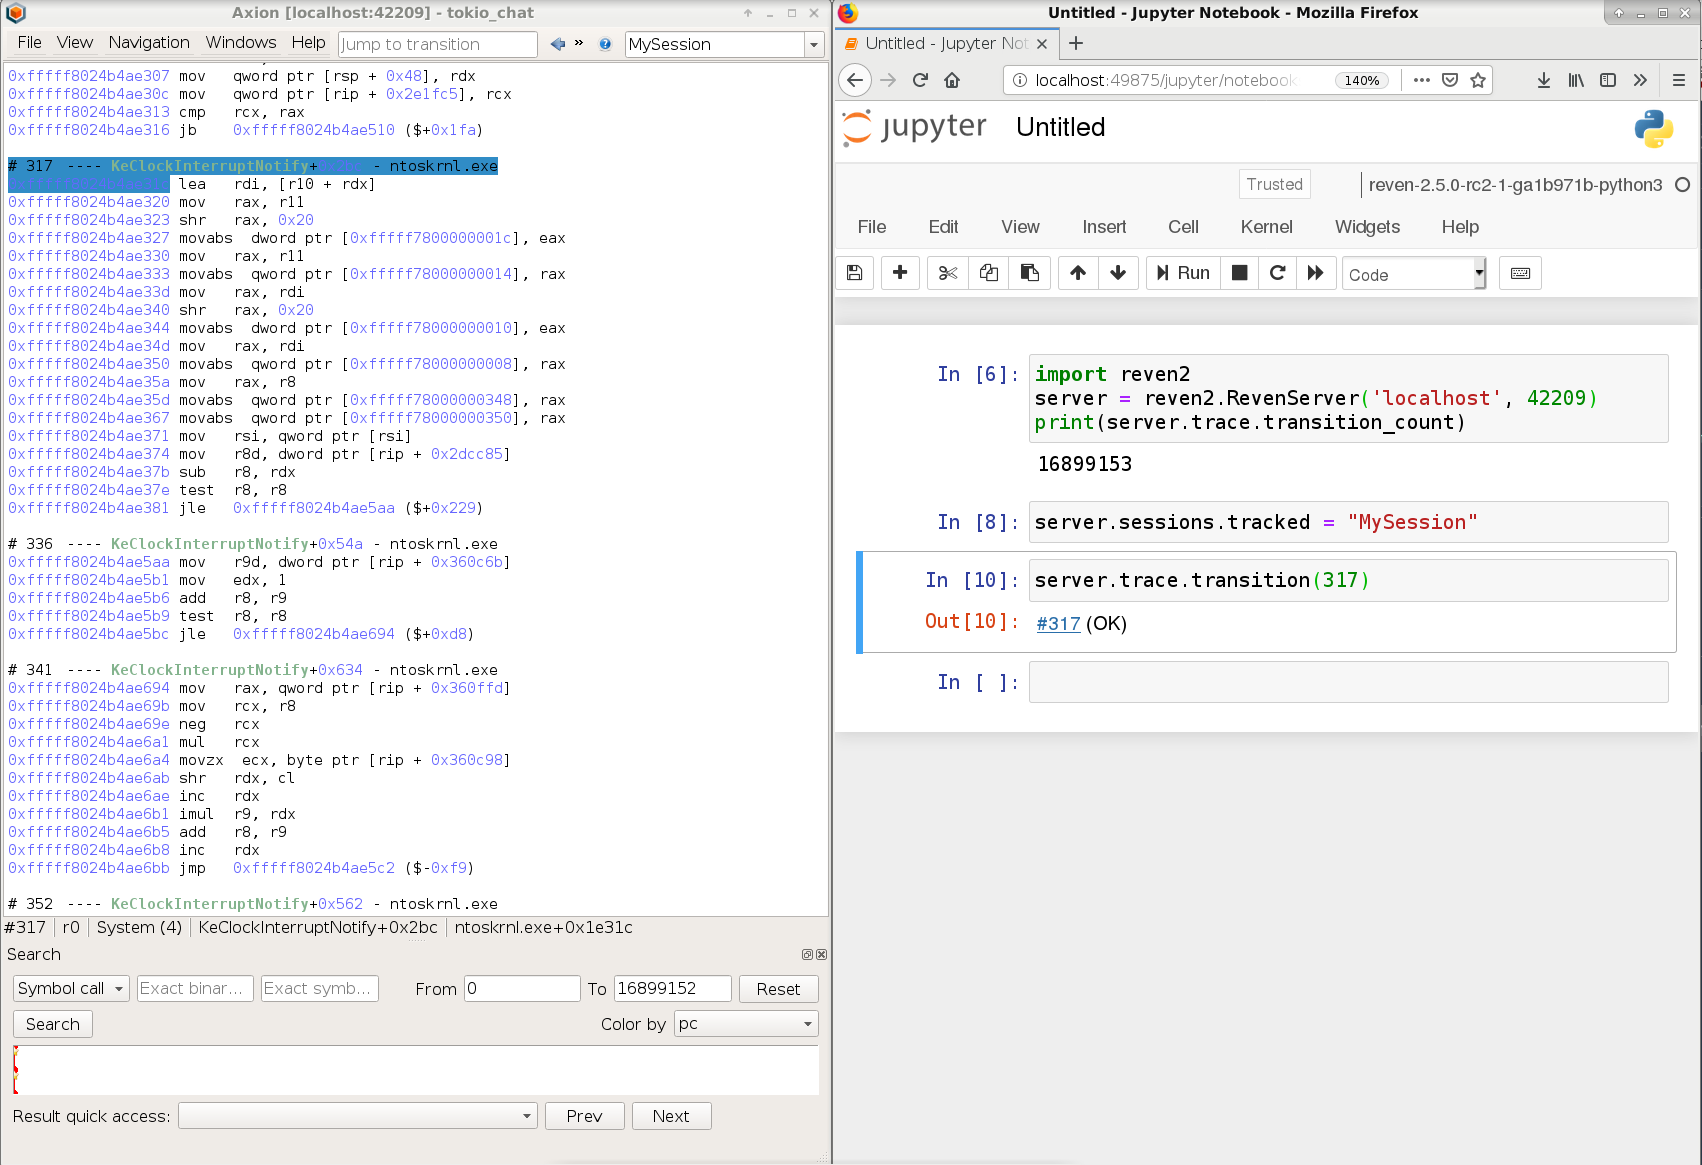
REVEN - Cookbooks
IMPORTANT: The automatic record feature is not available on the Free and Professional Editions. This section only applies to the Enterprise Edition.
REVEN - Auto-record on QEMU
IMPORTANT: The automatic record feature is not available in the Free and Professional Editions. This page only applies to the Enterprise Edition.
The auto-record feature in the Project Manager Python API allows you to perform a record without having you starting and stopping the record manually, detecting automatically when the record should start/stop instead. Also, when using the autorun feature, you will be able to completly bypass any manual interaction with the guest to perform the record.
Note that the auto-record functionality is currently in preview and exclusive to QEMU. As a result, it may contain bugs, and the interface is subject to change in a later version. In particular, the API we currently offer requires manipulating fairly low-level concepts.
This documents aims at explaining how to use the auto-record API. To do so, it covers the following topics:
- The general concepts of automatic recording required to use the API
- How to use autorun to allow a fully automated recording
- How to use the two auto-record types available in the API:
- Recording a single binary
- Recording using ASM stubs to allow precise control over when to start/stop the record from inside the guest.
You can find a complete example of using the auto-record feature in the Project Manager Python API examples named automatic-binary-record.py.
General
Concept
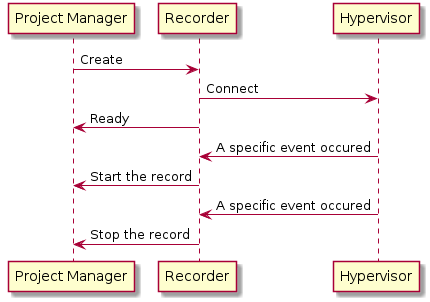
To perform auto-records, the Project Manager uses a recorder, which will communicate with the hypervisor in order to monitor the execution in the guest. So, the recorder knows what is happening on the guest, and is able to ask the Project Manager to start or stop the record after a specific event occurred. (e.g the start of a binary or a special sequence of ASM instructions executed by the guest).
The recorder requires initialization before it can enter the ready state, and this operation can take time depending of the state of the guest.
As a result, you will need to monitor the status of the recorder. You can retrieve the current status of the recorder from the field recorder_status of an auto-record task (retrieved by calling the get_task method of the Project Manager Python API)
Here is the list of possible statuses:
NOT_READY: Therecorderisn't ready and initialized yetREADY: Therecorderis ready, it will start the record as soon as the expected event occursRECORDING: The record has been startedRECORDED: The record has been stoppedFAILED: The auto-record failed for a specific reason (you can retrieve the reason in the fieldfail_reasonof a auto-record task)ABORTED: The record was aborted for a specific reason (you can retrieve the reason in the fieldfail_reasonof a auto-record task)TIMEOUT: The auto-record timed out before the start of any record (see the argumenttimeout_startin the next section)RECORD_TIMEOUT: The auto-record timed out during the record. The record was saved anyway. (see the argumenttimeout_recordin the next section)RECORD_COMPLETED: The auto-record succeeded and the record was saved
You should not assume that the recorder_status will only go from the RECORDING to the RECORDED status: you will encounter cases where the status will reach RECORDED at some point, and then go back to RECORDING. This may happen for instance when recording a binary because the recorder has detected that it may reduce the trace size without losing useful information, by stopping the current record and starting a new one. Similarly, code that uses the ASM stub is free to start and stop several records.
When the recorder is ready, the Project Manager will insert a CD-ROM into the guest containing the input files of the scenario and the mandatory file for the autorun.
Generic arguments
The auto-record feature is accessible via the Project Manager Python API via one method per auto-record type. All the methods use a set of common arguments described here:
qemu_session_id: The id of the session used during the auto-record (you can retrieve it in the JSON when using thestart_qemu_snapshot_sessionmethod from the Project Manager Python API to start a snapshot)scenario_id: The id of the scenario where the record will be saved, it should not already contain a record.timeout_start: The maximum number of seconds to wait between the point where the recorder is ready and the start of the record (default:300,0for infinite).timeout_record: The maximum number of seconds to wait when recording before stopping it (default:60,0for infinite).autorun_binary: See the next section.autorun_args: See the next section
Each of these methods returns a JSON object with a task key containing the representation of a task. With this data and the get_task method of the Project Manager Python API, you can pull the task's data repeatedly to know when the auto-record is finished, and get the recorder_status (a status listed in the previous section) (See the Project Manager Python API examples).
How to wait the end of the auto-record
from reven2.preview.project_manager import ProjectManager

# Connecting to the Project Manager with its URL.
project_manager = ProjectManager(url="https://user:password@url.to.project.manager:8880")

# Launching the auto-record and retrieving its task
auto_record_task = project_manager.auto_record_XXX(
	# ...
)['task']
print("Launched auto-record task with id: %d" % auto_record_task['id'])

# Waiting for the end of the task
while not auto_record_task['finished']:
	sleep(1)

	# retrieve the task with updated information
	auto_record_task = pm.get_task(auto_record_task['id'])
	print("Recorder status: %s" % auto_record_task['display_recorder_status'])

print("Auto-record finished with status: %s" % auto_record_task['status'])
Autorun
When using either of the automatic recording methods, the Project Manager will allow you to automatically launch a binary, script or command on the guest. This allows for a fully automated record without any interaction from the user.
Note that although autorun isn't mandatory by itself, if you don't use it you will have to interact manually with the guest, e.g. to launch the binary you want to record.
To enable autorun on the guest, you will have to configure your guest to automatically execute the script contained in a CD-ROM following some instructions.
To enable the autorun on the automatic record, you will have to use these arguments:
autorun_binary: The binary, script or command to autorun on the guest when launching the auto-record. This could be either a string or the id of a file that was already uploaded to the Project Manager. Note that this will be launched from a bat script on Windows, so any valid batch command will also work, the same applies to Linux with bash.autorun_args: The arguments to give to theautorun_binary
NOTE: When the autorun is enabled, all the content of the folder will be copied to C:\reven\ on Windows and /tmp/reven on Linux and executed from there.
Commiting the record to a scenario
The autorecord will generate a record the same way you can do it with start_record and stop_record and will also need to be saved in a scenario by using commit_record.
You can do something as follow:
# Auto record stuff...

# - `auto_record_task` contains the JSON of the task after the end of the auto record
# - `session` contains the JSON of the session
# - `scenario` contains the JSON of the scenario

pm.commit_record(session['id'], scenario['id'], record=auto_record_task['record_name'])

# Now you have a scenario with a record, you can replay it.
Examples
Launching a custom Windows script
project_manager.auto_record_XXX(
	autorun_binary="my_script.bat",
	autorun_args=[
		"1",
		"\"C:\\Program Files\"",
	],
	autorun_files=[
		42, # Id of `my_script.bat`
	]
	# ...
)
This example will launch the script my_script.bat also embedded in the CD-ROM like the following:
"my_script.bat" 1 "C:\Program Files"
Warning: To access my_script.bat from the guest, you need to put its id in the autorun_files argument
Launching a binary already in the guest
project_manager.auto_record_XXX(
	autorun_binary="C:\\Program Files\\VideoLAN\\VLC\\vlc.exe",
	# ...
)
This example will launch the executable C:\Program Files\VideoLAN\VLC\vlc.exe that is already present on the guest
Prepare the autorun
Windows
To allow autorun on Windows, you need to:
- disable Windows Defender:
- As an Administrator, launch
gpedit.msc. - On newer version of Windows, navigate to "Local Computer Policy\Computer Configuration\Administrative Templates\Windows Components\Microsoft Defender Antivirus\Real-time Protection\Turn off real-time protection" and
set the
Enabledradio button. - On older version, navigate to "Local Computer Policy\Computer Configuration\Administrative
Templates\Windows Components\Windows Defender\Turn off Windows Defender" and
set the
Enabledradio button.
- As an Administrator, launch
- enable
AutoPlayin the control panel (Hardware and Sound>AutoPlay) by setting "Software and games" to "Install or run program from your media".
NOTE: If autorun does not work despite following the instructions of this section, check that the
ShellHardwareDetection service is running. If it is not, enable the service and reboot the virtual machine.
If AutoPlay is disabled on your guest, you can still use a bat script which must be already launched on the guest when you start the automatic recording.
@echo off
title Wait CDROM Windows

:Main
timeout 2 > NUL
dir D:\ 1>NUL 2>NUL || GOTO Main

D:\autorun.bat
Warning: This script assumes that the CD-ROM will be mounted in D:, if it's not the case on your guest you should change it accordingly
Linux
Linux doesn't have an AutoPlay feature like Windows, so you will have to use a script to reproduce this feature. Like in Windows, this script must be already launched on the guest when you start the automatic recording if you want to use autorun.
#!/usr/bin/env bash

MOUNT_PATH=/media/cdrom0

while ! mount ${MOUNT_PATH} &> /dev/null
do
    sleep 0.3
done

source ${MOUNT_PATH}/autorun.sh
Warning: This script was tested on a Debian guest, it may require modification in order to work for other distributions
Binary recording
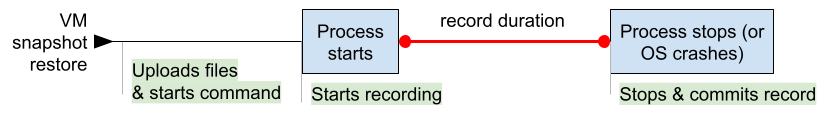
Requirements:
- The guest must be a Windows 10 x64
- The snapshot must be prepared
- The mandatory PDBs should be available through the symbol servers or available in the symbol store
- The guest should be booted
- If you want to use the autorun, it must be configured.
To record a specific binary from the start of it until it exits, crashs or BSOD, you have to use the auto_record_binary method of the Project Manager Python API.
When using this auto-record, the recorder will resolve and watch specific Windows symbols, such as CreateProcessInternalW that is used to spawn new processes.
This method will record at least from the CreateProcessInternalW function and try to reduce the record by re-starting it at some important points using heuristics. Generally the first instruction of your trace will be the first instruction of the binary (on the entry point), but for some binaries the trace might instead start at the CreateProcessInternalW.
To indicate which binary you want to record, this method takes an extra parameter called binary_name, which should contain either the full name of the binary with the extension (and optionally with some parts of its path) or the id of a file that was previously uploaded to the Project Manager.
Note that autorun_binary and binary_name are different, autorun_binary is used to automatically execute something on the guest but won't start the record by itself, binary_name is an indication of which binary should be recorded.
Examples
project_manager.auto_record_binary(
	binary_name="my_binary.exe",
	# ...
)
Will record C:\my_directory\my_binary.exe but not C:\my_directory\my_second_binary.exe.
project_manager.auto_record_binary(
	binary_name="my_directory/my_binary.exe",
	# ...
)
Will record C:\my_directory\my_binary.exe but not C:\my_second_directory\my_binary.exe.
project_manager.auto_record_binary(
	binary_name="directory/my_binary.exe",
	# ...
)
Won't record C:\my_directory\my_binary.exe nor C:\my_second_directory\my_binary.exe.
Warning: Because the auto-record of a binary is based on the arguments of the function CreateProcessInternalW, you should provide a binary_name that is present in the command line used to launch it. See the next example.
project_manager.auto_record_binary(
	binary_name="my_directory/my_binary.exe",
	# ...
)
Here is some batch command lines to see when the record will be started and when not:
Rem This won't be recorded
cd my_directory
my_binary.exe

Rem This will be recorded
my_directory\my_binary.exe

Rem This won't be recorded
my_directory\my_binary

Rem This will be recorded
my_first_directory\my_directory\my_binary.exe

Rem This will be recorded
C:\my_first_directory\my_directory\my_binary.exe
If you want to use autorun to directly launch the binary instead of launching it yourself on the guest you can do something like the following:
project_manager.auto_record_binary(
	autorun_binary="my_binary.exe",
	binary_name="my_binary.exe",
	# ...
)
Or using ids:
project_manager.auto_record_binary(
	autorun_binary=5, # 5 is the id of the file "my_binary.exe" already uploaded to the Project Manager
	binary_name=5,
	# ...
)
Recording via ASM stubs
Requirements:
- If you want to use the autorun, it must be configured.
Automatic recording using ASM stubs allows you to directly control the record from the guest, e.g. to only record the execution of a specific function.
Using the ASM stubs described in the next section you are able to start, stop, etc the record automatically from within the VM. However, note that this ability comes with its own drawbacks, such as needing to modify a binary to insert the ASM stubs on the function you want to record.
NOTE: Auto-recording using ASM stubs should be OS agnostic, and was tested successfully on Windows 10 x64 and Debian Stretch amd64
ASM stubs
The ASM stub works by hijacking an instruction in the guest so that it is interpreted differently in the hypervisor when used with a specific CPU context. In REVEN, the ASM stub is the instruction int3 (bytecode 0xcc), when executed with a magic value in rcx.
So, when calling int3 you need to set these registers accordingly:
rcxto the magic value0xDECBDECBraxto the number id of the command you want to execute (see below)rbxto the argument to this command
The list of commands is:
0x0to start the record (if already started restart it). The argument must always be1for now.0x1to stop the record. No argument.0x2to save the record (save it and stop the auto-record here). The argument must always be1for now.0x3to abort the record. The argument is eitherNULLor a pointer to a NUL-terminated string containing the reason of the abort.
Examples
Recording a function execution
If you have an executable my_binary.exe with these sources:
void function_to_record() {
	// ...
}

int main() {
	// ...

	// Start the record
	__asm__ __volatile__("int3\n" : : "a"(0x0), "b"(1), "c"(0xDECBDECB));

	function_to_record();

	// Stop/commit the record
	__asm__ __volatile__("int3\n" : : "a"(0x1), "c"(0xDECBDECB));
	__asm__ __volatile__("int3\n" : : "a"(0x2), "b"(1), "c"(0xDECBDECB));

	// ...
}
You can record it like the following:
project_manager.auto_record_asm_stub(
	autorun_binary="my_binary.exe",
	# ...
)
Recording two executables
If you want to record the execution of my_binary.exe and also my_second_binary.exe you can use something like the following.
With a binary start_record.exe:
int main() {
	// Start the record
	__asm__ __volatile__("int3\n" : : "a"(0x0), "b"(1), "c"(0xDECBDECB));
	return 0;
}
With a binary stop_record.exe:
int main() {
	// Stop/commit the record
	__asm__ __volatile__("int3\n" : : "a"(0x1), "c"(0xDECBDECB));
	__asm__ __volatile__("int3\n" : : "a"(0x2), "b"(1), "c"(0xDECBDECB));
	return 0;
}
With a script my_script.bat:
@echo off
C:\reven\start_record.exe

C:\reven\my_binary.exe
C:\reven\my_second_binary.exe

C:\reven\stop_record.exe
You will be able to record them by uploading all these files into the Project Manager and calling auto_record_asm_stub like the following:
project_manager.auto_record_asm_stub(
	autorun_binary="my_script.bat",
	autorun_files=[
		42, # Id of `my_script.bat`
		43, # Id of `start_record.exe`
		44, # Id of `stop_record.exe`
		45, # Id of `my_binary.exe`
		46, # Id of `my_second_binary.exe`
	]
	# ...
)
Mixing modes: binary recording + ASM stubs
The binary recording mode allows overriding its operations with ASM stub commands during the recording phase. This allows for more control in binary recording mode while still keeping the OS-related automation such as automatic recording stop on process stop or OS crash.
Binary recording mode automatically allows mixing ASM stubs, there is no option necessary to select.
Here is an example where the program will manually restart the recording even though the Binary recording mode had started it ealier:
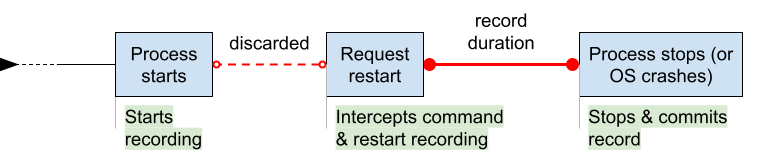
In general, when mixing modes, ASM stub commands have priority over the binary recording heuristics while still allowing levegaring the binary automation:
- When the binary recording detects a start condition (process start):
- if the recording is already started, do nothing (do not restart it)
- if the recording has not started, start it
- When the binary recording detects a stop condition:
- if the recording is started, stop it
- if the recording is stopped, report an error
This mode makes it easier to record various situations, notably non-deterministic crashes: restarting a recording from within the program is easy, and the binary recorder will still catch the crash.
REVEN - Auto-record with a VirtualBox VM
IMPORTANT: The automatic record feature is not available in the Free and Professional Editions. This page only applies to the Enterprise Edition.
IMPORTANT: Contrary to QEMU, auto-record with a VirtualBox VM is not currently available in the Project Manager. However, this page will explain how to build your own auto-record with VirtualBox without any manual interaction with the guest.
This document covers the following topics:
- How to record with VirtualBox without using the keyboard shortcuts.
- How to autorun your binaries in the guest.
You can find a complete example of auto-record with VirtualBox in the
Project Manager Python API examples called
vbox-automatic-record.py.
Recording a scenario in VirtualBox with ASM stubs
REVEN uses an hijacked instruction executed in the guest and interpreted
differently in the hypervisor to control the record from the inside. This
instruction is int3 with the magic value (0xDEADBABE) in rdx.
The commands are:
0xEFF1CAD6to start the record (when started you won't be able to restart it)0xEFF1CAD1to stop the record and stop the VM
Preparing the binary
If you have a binary containing a function you want to record you can use ASM stubs:
void function_to_record() {
	// ...
}

int main() {
	// ...

	// Start the record
	unsigned ret;
	__asm__ __volatile__("int3\n" : "=a"(ret) : "a"(0xEFF1CAD6), "d"(0xDEADBABE));

	function_to_record();

	// Stop the record and the VM
	__asm__ __volatile__("int3\n" : : "a"(0xEFF1CAD1), "d"(0xDEADBABE));

	// Can't reach this point, the previous ASM stub should have stopped the VM
	__asm__ __volatile__("ud2");
}
Launching the binary in a prepared guest (see below) will automatically start and stop the record.
Preparing the guest
The guest must be configured in the same way as for QEMU autorun. Then the instructions below must be followed.
Windows
IMPORTANT: The VM must be started in the step Record of the workflow of a
scenario or from the Project Manager Python API using the method
start_vbox_snapshot_session with the argument scenario containing the id of
the scenario where you want to save your record.
On Windows, AutoPlay (if configured correctly) will use the file autorun.inf
at the root of the CD-ROM to know what to execute.
For example:
[autorun]
open=autorun.bat
shell\open\Command=autorun.bat
This will execute autorun.bat when the CD-ROM will be inserted.
If autorun.bat contains something like that:
@echo off
D:\my_binary.exe
With my_binary.exe containing the ASM stubs responsible for the start/stop of
the record, you will just need to insert a CD-ROM into the guest containing
autorun.inf, autorun.bat and my_binary.exe to auto-record what you want to
record.
Linux
IMPORTANT: The VM must be started in the step Record of the workflow of a
scenario or from the Project Manager Python API using the method
start_vbox_snapshot_session with the argument scenario containing the id of
the scenario where you want to save your record.
As Linux doesn't have the AutoPlay feature, you should have configured it to
use a script which will execute automatically autorun.sh when the CD-ROM is
mounted.
So, if autorun.sh contains something like that:
./my_binary
with my_binary containing the ASM stubs responsible for the start/stop of the
record, you will just need to insert a CD-ROM into the guest containing
autorun.sh and my_binary.exe to perform the auto-record.
Advanced usage
REVEN v1 used what we called preloaders that were responsible for starting
the record at the start of the binary by using various methods:
- On Linux: using the
ptraceAPI to single step until the entry point is found. - On Linux: using a
.sodynamically loaded withLD_PRELOADsetting a breakpoint at the entry point. - On Windows: using the Windows API to start a suspended process and patch it.
You can reproduce some of these methods using the ASM stubs approach explained above.
Integration of WinDbg within REVEN
When working on a Windows scenario, whether in user land or kernel, WinDbg is always a tool of choice for its deep understanding of the OS and its environment.
This is also true when performing timeless analysis with REVEN, where WinDbg can be of some great help to:
- Perform debugger-assisted recording so as to choose start and stop record points accurately and keep records short and to the point.
- Provide advanced analysis information when analyzing a recorded and replayed scenario.
Debugger-assisted recording with WinDbg
When doing a debugger-assisted recording, you will connect WinDbg in kernel mode to a VM at the recording stage of a scenario via REVEN's Virtual Machine Introspection (VMI) capabilities. From that point, you can:
- Use breakpoints to control the recording stage more finely (see how here).
- Get a debugger at the start of a process you wish to record (see how here).
- Inspect the VM state to validate conditions, while it is being recorded.
- Orchestrate the recording of multi-process cases.
Trace analysis with WinDbg
You can connect WinDbg in kernel mode to a REVEN trace. In this case, the trace is presented as a live running VM to the debugger. This allows you to:
- Navigate the trace in a familiar environment while retaining the timeless aspects even in kernel space.
- Get high level semantic information: handles, kernel objects, etc.
- Explore data structures declared in PDBs.
- Get information about the system such as all running processes.
- Run existing scripts you might have already created for your use cases.
RvnKdBridge
In both situations, the integration works via a bridge program called RvnKdBridge. It is intended to run on Windows alongside your WinDbg client: it will connect to the REVEN VM or trace on one side, and create a named pipe WinDbg can connect to on the other.
Please read the following pages for further information:
Connecting WinDbg
REVEN integrates WinDbg at multiple stages of the workflow. See the parent page for more information.
Debugger-assisted recording and trace analysis are two different use cases but both require connecting WinDbg in a similar manner. This page will describe how to set this connection up in both situations:
- Selecting the target and finding its port
- Debugger assisted recording: the target is a VM
- Trace analysis: the target is a trace
- Connecting the bridge to the target
- Connecting WinDbg to the bridge
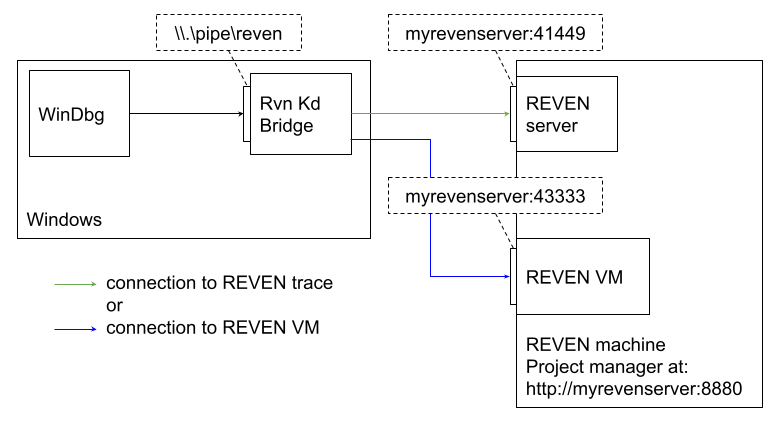
Prerequisites
Installing RvnKdBridge
You can find RvnKdBridge in the DOWNLOADS section of the Project Manager. Extract it on the machine where WinDbg will run.
Network setup
The machine on which WinDbg will run must have network access to the REVEN server, not only on the Project Manager port but also to the target's port (see section below).
Starting the target and finding its port
RvnKdBridge will connect to a target identified by a port number. Which target to connect to depends on your use case.
Debugger-assisted recording
When using WinDbg to help with the recording of a scenario, your target is the VM. You must use the VM debugger connection port number:
- Go to the "Record" page of the scenario you are about to record.
- If not already running, start the VM as usual.
- In the "Debugger-assisted recording" section, click on "Enable debugger connection".
- The target port appears below:
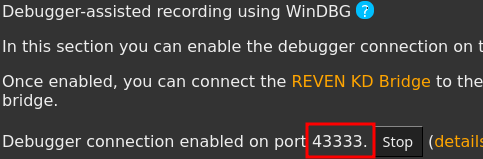
Note there are requirements on the target VM:
- The VM snapshot must be prepared
- The kernel must be mapped in memory at the time of connection. This is generally the case in a fully booted VM.
- All versions of Windows supported by REVEN are supported.
Note that it is not required to start the VM with /debug.
Trace analysis
When trying to analyze a trace with WinDbg, you must use the REVEN's port number you can find on the "Analyze" page of the scenario:
- Go to the "Analyze" page of the scenario you want to connect to
- If not already running, open the trace by clicking on "Start REVEN server"
- The REVEN trace port appears below:
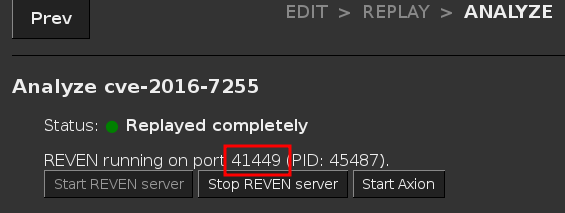
Note there are requirements on the REVEN scenario:
- All OS Specific Information (OSSI) resources must be replayed.
- All versions of Windows supported by REVEN are supported.
Note that it is not required to start the VM with /debug when preparing it for recording.
Connecting the bridge to the target
Launch the program RvnKdBridge.exe. There are multiple fields to fill in.
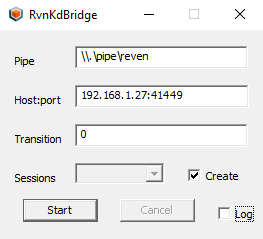
Pipe: Path of the named pipe to create. The format is\\.pipe\<mypipename>, for example\\.pipe\reven.Host:port: Description of the project's server & port. The format is<hostname>:<port>.- The host is the address of your server
- The port is the one you have determined in the previous step.
Transition:- If the target is a trace: at which transition in the trace the bridge will start. WinDbg will see the REVEN trace as a VM stopped at this point in time for debugging.
- If the target is a VM: this parameter is ignored, you should set it to 0.
Createcheckbox: Whether or not a new synchronization session for Axion should be created. Ignored if the target is a VM.
Connecting WinDbg to the bridge
The next step is to connect WinDbg to the named pipe you specified. The procedure differs slightly between WinDbg x64 and WinDbg Preview.
In WinDbg x64, follow the steps below:
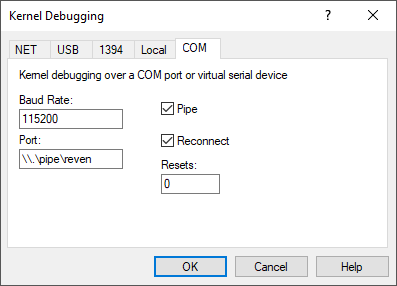
- Click on
File - then
Kernel Debug. - Select the
COMtab, - Check
Pipe. - In the
Porttext field, enter the name of the pipe. - Finally, click on
OK.
In WinDbg Preview, follow the steps below:
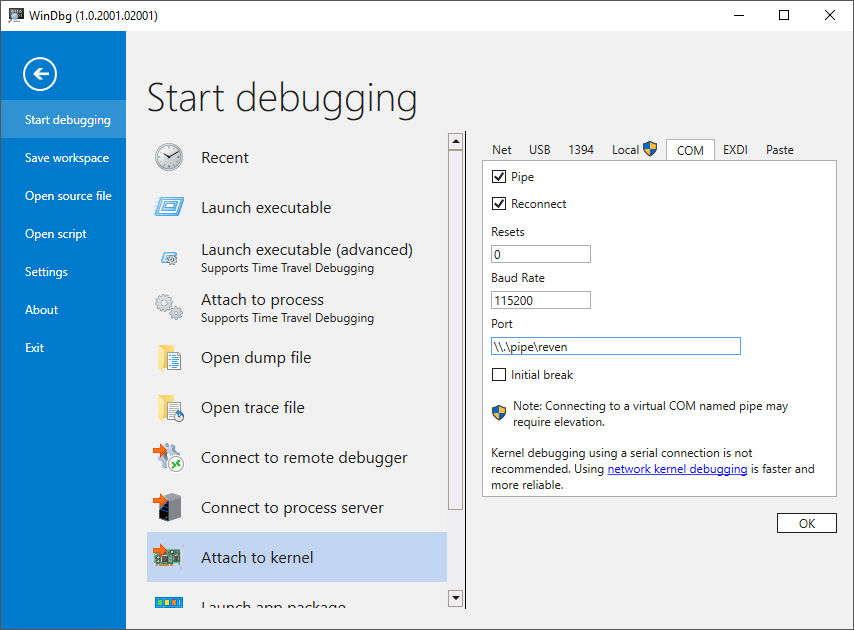
- Click on
File Start debugging- then
Attach to kernel. - Select the
COMtab, - Check
Pipe. - In the
Porttext field, enter the name of the pipe. - Finally, click on
OK.
Using WinDbg
In both use cases, WinDbg is connected in kernel mode. See the Usage page for specificities of using WinDbg in this context.
General usage
REVEN integrates WinDbg at multiple stages of the workflow. See the parent page for more information.
This page contains general information about the possible usage & limitations of WinDbg in both debugger-assisted recording and trace analysis use cases.
Reading the state
Most commands that read the current state of the debuggee will work. For example:
.reloadis necessary, thenlmk,dt.tlist,!peb,!handle,!time- Reading memory, especially reading structured data
- etc.
Note that in certain areas (such as interrupts often found at the start of a trace, or in a VM), some commands (callstack or !peb for example) may return unexpected results. This appears to be due to the state of the target at this point (exception handling).
Navigating
Navigation is mostly similar whether connected to a trace or a VM. See the next section for specificities when connected to a trace.
- You can use basic WinDbg tracing and stepping commands to move in the trace or the VM. For simple commands, like
t, WinDbg will go automatically to the next transition. - You can set breakpoints using the usual breakpoint commands. The
resumecommand (g) can then be used to jump to the next transition where a breakpoint is hit.
Trace-analysis specificities
Navigation
When navigating a trace with WinDbg, certain commands cannot fully execute because they reach the end of a trace:
- Stepping out (
gu) of a function that never returns. - Resuming the VM (
g) when no breakpoint is set (or no set breakpoint has a hit)
In this case, the bridge will request focus, and allow the user to specify a new transition number to break at.
Hence, whenever you wish to jump to a certain transition number you can:
- Deactivate all breakpoints,
- Resume the VM,
- Select the bridge program
- Enter the new transition number
- Click on "Start"
- Select the WinDbg window again: it has control of the trace again.
Moreover, the following navigation commands are not supported:
- Reverse step in / into / out
Synchronization with Axion
When analyzing a trace, you can synchronize the Axion GUI with WinDbg. In the bridge, set the Sessions combo box to select a session name. You can then select the same session name in an Axion GUI client connected to the same REVEN trace.
When setup, each time a new transition is selected in WinDbg (for instance using commands to browse the trace), the same transition will also be selected in Axion.
NOTE: if you checked the Create checkbox next to the Sessions combo box, then a new session name will be generated by the bridge upon connecting to the server.
Current known limitations/issues
Regardless of the use case, commands that would end up writing to the debugged system are not supported, even when connecting to a VM:
- Changing registers
- Writing to memory
- Any command that would result in a write to the debuggee's state, such as changing process via
.process /i
Note that these do not make sense in the context of a REVEN trace, since we're working on a read-only trace. And while they would make more sense in the context of a VM, they are not supported there as well.
Finally, the following WinDbg functionalities are not supported:
- Memory breakpoints.
sx*commands to control the debugger's behavior on common events.
Use cases
REVEN integrates WinDbg at multiple stages of the workflow. See the parent page for more information.
This page describes common operations you might need, especially when using WinDbg in the context of a debugger-assisted recording.
Notably, breaking the VM with breakpoints is supported even while recording. Moreover, starting or stopping a recording is possible while the VM is paused.
I want to start and stop recording a scenario at a precise function
- Create a new scenario, start your VM & your program.
- Connect WinDbg to that VM
- The VM pauses in a random process and hands over control to WinDbg. Find the target program as described below.
- You can now set breakpoints (using symbols, RVA or absolute addresses) so as to pause the VM right before what you need to record.
- Resume the VM.
- At some point, a breakpoint hits and control is handed over to WinDbg.
- Head over to the Project Manager's record page and click on "Record".
- Set new breakpoints to catch the end of what you want to record.
- Resume the VM: the recording effectively starts.
- Another breakpoint hits: click on "Stop record" in the project manager.
NOTE: you can pause the VM at anytime during the recording, either manually with "Break" or via a breakpoint, and check the state of your VM, without affecting the on-going recording. This also allows for automatic conditional breakpoints, or further scripting.
NOTE: while breaking the VM does not affect the recording, it might still have consequences on the on-going program. Network timeouts are an example of such side effects.
I want to place breakpoints into an on-going program in a VM, or inspect its state
In this basic use case, you have a program currently running on your VM, and you want to inspect its state.
Assuming you connected WinDbg to that VM, first you need to locate your program:
-
Enter
.reloadso WinDbg has the information it needs. -
Find your target process:
* 1. Look for the target process. You can find it with for example: dx @$targetP = @$cursession.Processes.Where(p => p.Name.ToLower().Contains("<mybinary>")).First() * If not, open the Debugger Data Model, look for its handle, then enter: dx @$targetP = @$cursession.Processes[<0xHandle>] -
Set this as the implicit process & reload user space:
dx @$targetP.SwitchTo() .reload /user -
From there, you can inspect the process's memory, place breakpoints, etc.
At this point the target program is not effectively running or scheduled, so this might not be enough:
- Stepping will not get you inside your target process
- You don't know which thread is currently running The next section will show you how to do this.
I want to break into an on-going program so I can step into it
Assuming you followed the previous section, you may still want to schedule the process. The command .process /i does not work in this context (see why), so you must do it manually. There are two options:
-
You can either explore the stack of your process' threads, and go to the relevant function:
* 1. Explore the list of threads: dx -r2 @$targetP.Threads.Select(t => t.Stack.Frames) * 2. - Locate the call you want to get back into - Navigate to find its Attributes.InstructionOffset, and get there. g 0xValue * When the VM breaks again, reload user land. .reload /user -
Alternatively, if you don't know which function or thread to get back to, you can simply wait for the process to be scheduled:
* Create a one-shot breakpoint into the process
  Note we are assuming all unscheduled threads have the same instruction offset.
dx Debugger.Utility.Control.ExecuteCommand("bp /1 /p " + ((__int64)&@$targetP.KernelObject).ToDisplayString("x") + " " + @$targetP.Threads.First().Stack.Frames.First().Attributes.InstructionOffset.ToDisplayString())

* Resume the VM
g

* When the VM breaks again, reload user land
.reload /user

* At this point, you are in kernel land.
  Use the stack to find a meaningful location to go to.
NOTE: the VM will be quite slow until this breakpoint is reached. This is due to having a conditional breakpoint on a very frequently-hit address.
I want to break at the start of a program
The currently supported perimeter does not include interrupting the VM on events using the sx* commands. However, we can manually break at the start of a program by placing a breakpoint on nt!NtCreateUserProcess.
- Place the breakpoint so that it catches the process creation function:
bp nt!NtCreateUserProcess g - Head over to the VM & launch your executable.
- The VM breaks. Execute the following commands:
* 1. First, ensure the process is effectively created
pt

* 2. We must find the newly created process. You can find it with for example:
dx @$targetP = @$cursession.Processes.Where(p => p.Name.ToLower().Contains("<mybinary>")).First()
*    If not, open the Debugger Data Model, look for its handle, then enter:
dx @$targetP = @$cursession.Processes[<0xHandle>]

* 3. Set the new process as the implict process & reload user space
dx @$targetP.SwitchTo()
.reload /user

* 4. Find the proper module to break into, usually the first one.
dx @$targetM = @$curprocess.Modules.First();
*    If not, explore the modules manually.

* 5. Wait for that entry point to hit
dx Debugger.Utility.Control.ExecuteCommand("g " + (@$targetM.Contents.Headers.OptionalHeader.AddressOfEntryPoint + @$targetM.BaseAddress).ToDisplayString())
You are now at the actual entry point of the program.
Troubleshooting
Here are answers to common errors you might encounter when using RvnKdBridge and the integration of WinDbg in REVEN.
Bridge cannot connect to the trace
First, double-check that you are providing the right address and port. See the section determining the port.
Then, make sure your network setup allows communication between your Windows machine and the REVEN server on this port.
WinDbg cannot connect to bridge
If WinDbg shows the error Kernel debugger failed initialization, Win32 error 0n1, make sure you did check Pipe while configuring the named pipe.
You may also get spurious errors such as Kernel debugger failed initialization, Win32 error 0n231 "All pipe instances are busy." - WinDbg might still be connected, in which case you can ignore this error.
Bridge connects, but fails to recognize kernel
RvnKdBridge has been tested on various kernels and traces, ranging from Windows 7 up to Windows 10 RS6. Still, you might encounter conditions where the bridge may not work: required memory areas are unexpectedly not mapped, or the kernel is not supported.
The logs window might help you troubleshoot the problem.
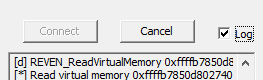
If you find a VM or a trace on which the bridge does not work, please try the following actions on the VM:
- Deactivate the pagination file
- Reboot the VM
- Once fully rebooted:
- Either try connecting the bridge to the VM debugger connection,
- Or record a small scenario on that VM and try connecting the bridge to the trace.
If these actions do not help, please contact the support by copying the logs, details about the VM such as kernel version, or ideally a very small scenario displaying the problem.
Trace analysis: the debugger commands (e.g. g) always prompt the bridge to ask for a transition manually
- If error messages such as "Could not set breakpoint" or "Could not resume" appear in the log, then the resources required by the debugger might be missing for your scenario. Check that the "Stack events" (in the "Backtrace & Callstack" feature) and the "PC Ranges" (in the "Fast search" feature) resources have been replayed for your scenario.
- If there are no breakpoints defined, or the defined breakpoints are never hit in the remainder of the trace, this is the expected behavior.
Fuzzing & Triage Platform
The Fuzzing & Triage Platform demonstrates the integration of REVEN with fuzzers.
The platform monitors a directory for input files leading to crashes (crash files), record/replay them in REVEN, classify the crash using the REVEN trace and give it an unique identifier. This unique identifier allows us to determine if the directory contains files leading to the same crash multiple times.
Outline of the platform
The way the platform works can be summarized with the following diagram:
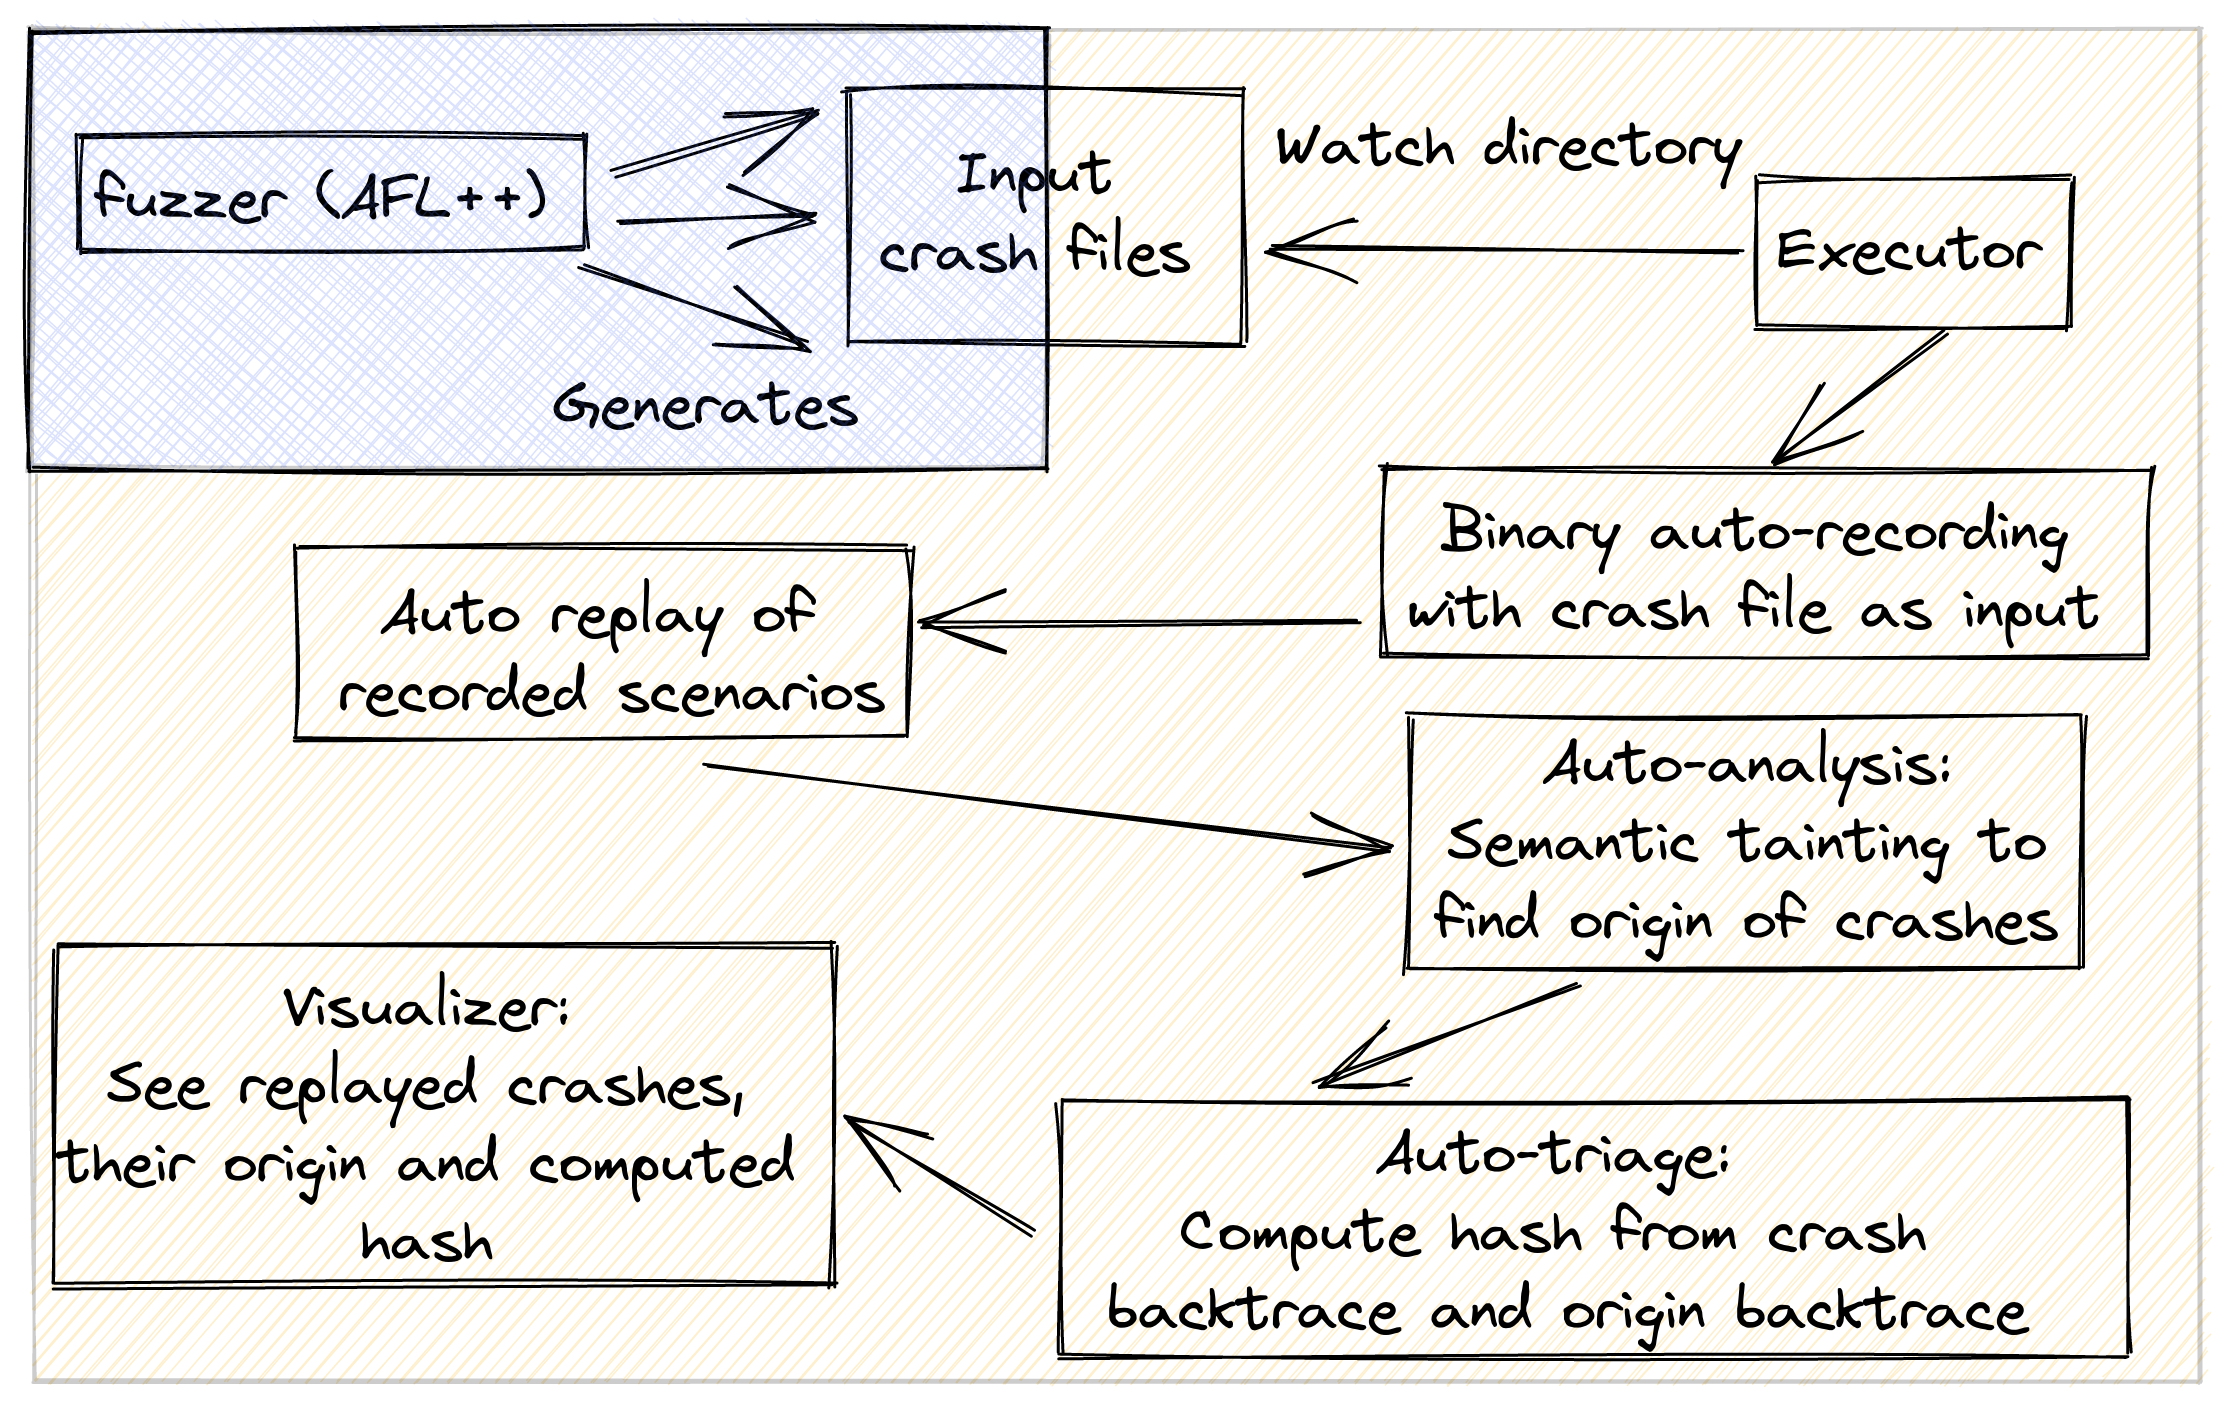
The platform can watch any directory for crash files. For each crash file appearing in the watched directory, the executor component of the platform will launch several steps:
- Record a fresh REVEN scenario from the test harness + the input file causing the crash
- Replay the recorded scenario
- Analyze the replayed scenario
- Find the crash point
- Find the origin of the data causing the crash
- Further minimize the number of "unique crashes"
The current status and the final report for each crash file can be monitored live in the visualizer view, a web page locally served by the platform.
Pre-requisites
- The platform, with the exception of the analyzer, is only available in the Enterprise Edition.
- Fuzzed binaries must be executable under Windows 10 x64.
Installation
1. In any environment
The recommended way to use the platform is from our integrated Jupyter Notebook server:
You can find the platform in the DOWNLOADS section of the Project Manager (find the link to that section in the footer of any Project Manager page). Extract the downloaded zip anywhere, then follow the instructions below to install the platform depending on your environment.
- In the footer of any Project Manager page, click the
DOWNLOADSlink. On the download page, save theFuzzing platform - Quick start guidefile. - In the footer of any Project Manager page, click the
NOTEBOOKSlink to open Jupyter Notebook. - In the Jupyter interface, create a new directory (e.g., "
fuzzing"). - In the newly created directory, click the "upload" button and upload
REVEN-2.11.0-fuzzing-platform.ipynb. - From Jupyter, open the
REVEN-2.11.0-fuzzing-platform.ipynbnotebook, and follow the instructions in the notebook.
2. In a Python virtual environment on native Debian Buster
Optionally, if using REVEN in the native Debian Buster package, you can install the platform in any Python virtual environment that also contains the reven2 package. You can then start the platform with the python fuzzing_platform.py command from within the virtual environment.
- In the footer of any Project Manager page, click the
DOWNLOADSlink. On the download page, save theFuzzing platform - Debian Buster Packagefile. - Unzip the downloaded zip.
- Refers to the
README.mdinside of the zip for installation and usage instructions.
Configuration and basic usage
If using the Jupyter notebook, configuration and basic usage of the platform will be covered as part of the notebook.
If using a manual virtual environment, these topics are covered (albeit, in a less interactive way) in the README for the platform.
Supported workflows
Currently, only Windows x64 binaries are supported for analysis. This leaves 2 supported workflows for using the platform:
- Fuzzing under Windows, putting the discovered crashed input files in a shared directory with the platform, and recording/replaying/analyzing crashes under Windows.
- Fuzzing under Linux, and recording/replaying/analyzing crashes under Windows. This latter workflow requires that the target can be compiled both for Windows and Linux.
Visualizer
To make easier to have a global view of the crashes, a web visualizer is also launched during the startup, by default it should be available on your web browser at http://localhost:5000.
Note that if you are running REVEN in a docker or in a VM, you may need to use the external hostname of the VM/docker to access it from your browser, or otherwise to expose the port from the Docker/VM.
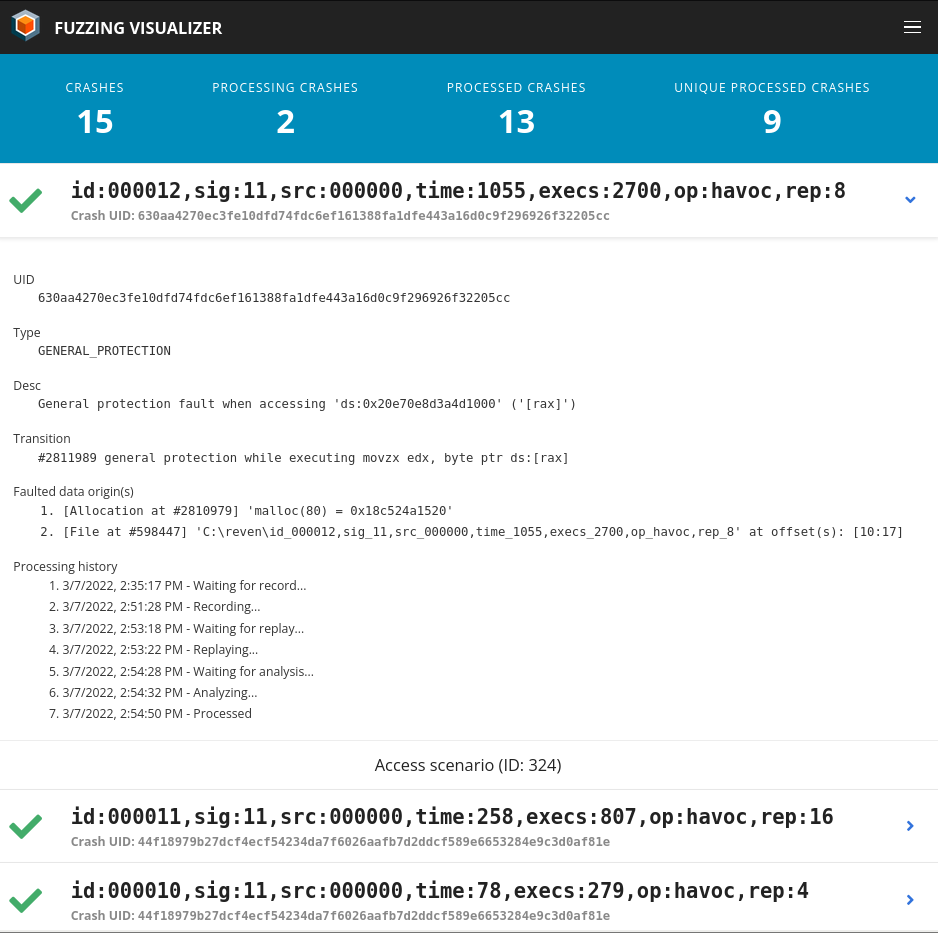
Standalone analyzer
To analyze already recorded scenarios, you can use the script analyze_scenario.py located inside the Fuzzing platform - Debian Buster Package zip file in the DOWNLOADS page of the Project Manager.
See its --help for more information about its usage.
Miscellaneous info about Project Manager and REVEN
Monitoring REVEN tasks and sessions
Using the Project Manager, you can monitor:
- Ongoing tasks such as:
- Replaying a scenario
- Preparing OS-specfic information related to a VM
- Sessions such as:
- Launched REVEN servers
- Launched Axion GUI
Learn more about Tasks & Sessions.
VirtualBox
REVEN can also record VMs running in VirtualBox, although this comes with significant drawbacks, meaning VirtualBox-based records are more of a niche use-case for advanced users. Learn more about this subject in VirtualBox
Tasks & Sessions
Tasks and Sessions are two concepts referring to actions run from the Project Manager. They can be displayed and managed from a dedicated tab in the interface.
Tasks are background jobs such as a replay or a PDB download. Users can launch a task and continue to do their work.
Sessions are directly usable processes such as a started VM, a REVEN server or a running Axion GUI.
Tasks
Tasks aggregate resources replay, VM OS Specific Information (OSSI) preparation and PDBs download.
In the Tasks & Sessions tab, you can perform the following actions on a task:
- Cancel: kills a pending or running task.
- Details: shows a task's characteristics and logs.
- Delete: remove a task's characteristics and logs from the Task list. Be aware that logs can be very useful for bug report and support.
Task statuses
A task can have the following statuses:
: Success, means the task has been completed entirely without any error.
: Failure or Aborted,
means the task has been stopped before the expected end.
This can happen in 2 cases:
- Failed: something went wrong, probably an error occurred during the execution. Please refer to the logs.
- Aborted: task has been canceled on purpose before completion.
: Started, means the task is running.
: Pending, means the task is not started yet. Two reasons can put a task in pending state: waiting for either system resources or replay dependencies to become available.
Sessions
Sessions aggregate interactive processes launched from the Project Manager: REVEN server, Axion and VMs.
In the Tasks & Sessions tab, you can perform the following actions on a session:
- Stop: stops a running session.
- Details: shows a session's characteristics and logs.
- Delete: remove a session's characteristics and logs from the Session list. Be aware that logs can be very useful for bug report and support.
Session statuses
A session can have the following statuses:
: Started, means the session is up and running.
: Stopped,
means the session has been stopped. Either the user closed/killed it manually or
they stopped it from the Tasks & Sessions tab via the Stop button.
Using VirtualBox Virtual Machines
With REVEN, you can build RE projects where analyzed scenarios are recorded from Virtual Machines (VMs) running in Oracle VM VirtualBox.
This section describes how to setup a VirtualBox VM that will be suitable for scenario recording.
Pre-requisites
IMPORTANT: Replaying scenarios recorded with a VirtualBox VM in REVEN will often lead to partial replays due to replay desynchronization errors. Therefore, using QEMU VMs is highly recommended and must be preferred. However, using VirtualBox VMs may prove successful in some rare cases where using QEMU VMs is not convenient or fails.
IMPORTANT: REVEN currently provides the analysis of scenarios with VirtualBox VMs only on servers equipped with Intel processors. It does not support such analysis on servers equipped with AMD processors.
IMPORTANT: The autorecord features of the Project Manager are not supported with VirtualBox VMs. With REVEN Enterprise edition, the ASM stub autorecord feature is available from the Workflow Python API.
VirtualBox is installed on the REVEN server during the REVEN installation process.
Should you need some advanced system configuration, such as
dedicating a USB device to a VM, you will have to manually add the Linux
user running REVEN to the Linux group vboxusers. If reven_user is the user
login, this can be done using the command line:
$ sudo adduser reven_user vboxusers
Managing remotely a VirtualBox machine may be done through a SSH connection with X-Forwarding enabled or with solutions such as phpVirtualbox or remotebox. We will not document them here.
Creating a VirtualBox VM for scenario recording
- Create a virtual machine in Oracle VM VirtualBox Manager. Please refer to VirtualBox's online documentation.
- Add an IDE adapter to the VM configuration (or make sure it exists). This can be done through the Storage section of the virtual machine settings:
- Set the IDE adapter name to
reven. - Set it as CD-ROM / primary master device.
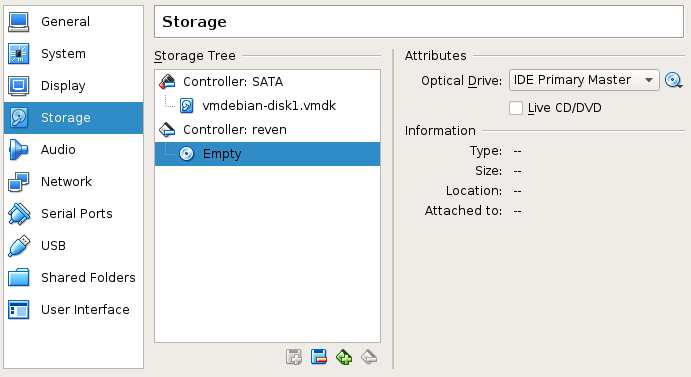
- Setup the
Systemsettings as follows: - In the
Processortab, set the number of processors to 1.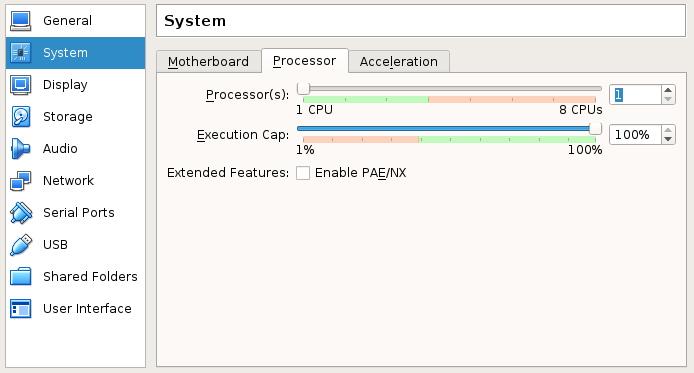
- In the
Accelerationtab:- Set the
Paravirtualization interfaceto None. - Check all boxes of
Hardware Virtualization.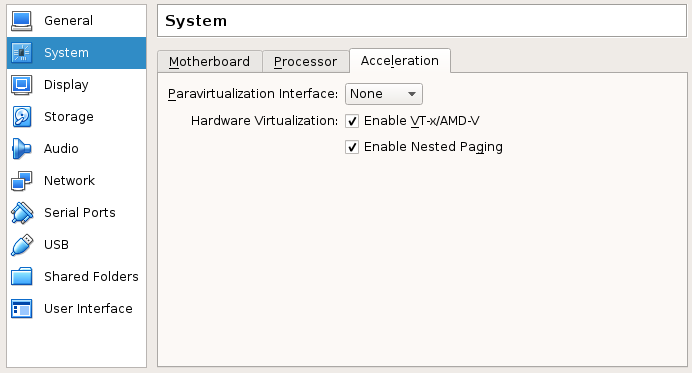
- Set the
- Setup the
Audiosettings either disabled, or enabled with the ICH AC97 audio controler selected. Otherwise, the Virtual Machine may not start. - Install the Microsoft Windows or Linux guest OS of your choice on the virtual machine.
WARNING: Make sure to remove any software that may communicate with
the VirtualBox hypervisor from the guest. Intrusive software such as
VirtualBox's Guest additions (which provides extended features like drag
and drop, clipboard sharing and full resolution display) may lead to unhandled
hypervisor behavior, and the recorded scenario will not be properly handled
by REVEN.
What you must know
VirtualBox saves states of a VM in Snapshots. Technically, there are Disk snapshots and Live snapshots.
Disk snapshots are saved while a VM is off, or by taking a snapshot on a running VM and discarding saved state.
Live snapshots are obtained by shutting down a VM and choosing Save state, or when you take a snapshot on a running VM.
For a given VM, REVEN's Project Manager will show you a single list of VirtualBox snapshots to record scenarios from.
Preparing VirtualBox snapshots to use with REVEN
We recommend the following approach to prepare a VirtualBox snapshot that will be used to record a scenario.
In the VirtualBox GUI:
- Create and setup the VirtualBox VM.
- Install software & configuration required by your scenario in the VM.
- Run operations required in the VM before the scenario recording, but that need not be recorded.
- Take a snapshot of the VM.
- Shutdown the VM.
In the REVEN Project Manager:
- If the VM has previously been registered, simply refresh the list of snapshots for the VM.
- If the VM has not been registered yet, simply register it. Its snapshots will be automatically known by the Project Manager.
Support
Need help using REVEN? This page details how to get help depending on your REVEN edition.
Free Edition
In the Free Edition, you can get support by opening an issue on the REVEN community repository.
Professional/Enterprise Editions
Owners of Professional and Enterprise licenses can also get direct email support at support@tetrane.com.